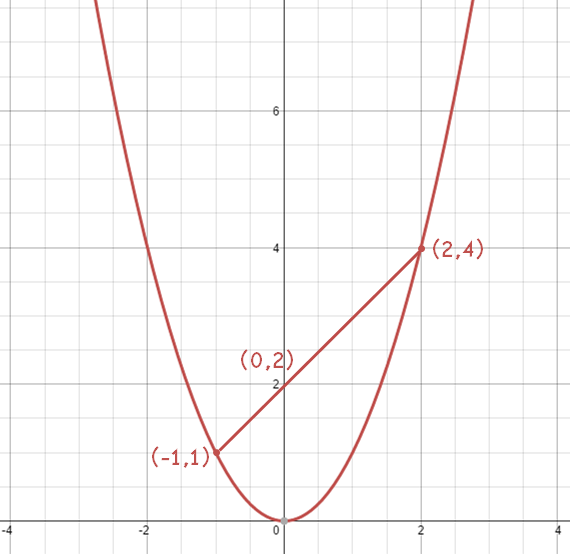
So here’s a cute idea I was talking to a colleague about yesterday. I think I got this from Johnny Ball when I saw him present at MathsConf3 last March. I’m unsure of any practical applications but it’s a nice bit of maths.
Draw a quadratic curve – the simplest one’s just y = x². Pick two coordinates, one either side of the y-axis. It’s most satisfying if you pick integer points, but works with any (x,y) coordinate pair. Then draw a line segment from one point to another.

From this we get a couple of nice little results:
- The negative product of the two x coordinates is the y intercept (here, -1×2 = -2, and the y intercept is 2.
- The sum of the two x coordinates is the gradient of the line (here, -1 + 2 = 2).
While not particularly groundbreaking (or, as far as I can work out, useful?), it would make a fantastic quick investigation for Higher GCSE pupils, and in particular offer lots of practice finding the gradient of a line joining two points.
(Graph created using Desmos, annotations my own)
