Tonight’s post is another quick one about using ratio tables, this time for solving proportional reasoning problems. I’ve previously blogged about using them for percentage calculations and converting fractions to percentages, so thought that a post on general proportional reasoning was long overdue! Note: The ideas detailed in this post took a good few lessons to work through, and we supplemented the discussions with lots of related practice.
By the time I got to proportional reasoning in our scheme of work this year, my classes had already had quite a lot of experience in using the bar model for solving fraction problems. I started off by working through one of the superb lessons I had from the NCETM last year, which looks at proportional reasoning using a bar.
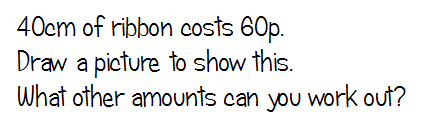
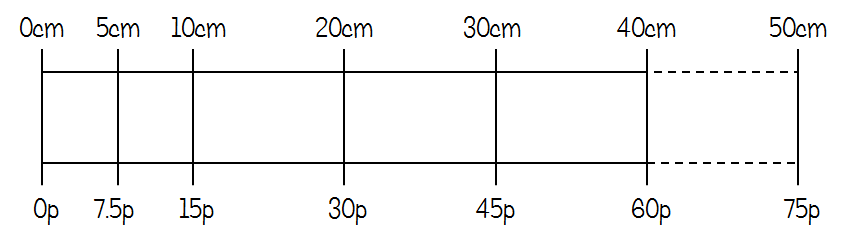
We started off with a prompt about buying ribbon. The context was deliberately chosen to encourage pupils to use a bar diagram, and many of them competently worked out lots of different amounts. With a little prompting, they thought a little further and realised that they could also extend the bar to find amounts greater than 40cm.
Once we’d played around with these ideas for a bit, including doing lots more diagrams for different ribbons with different prices and amounts, I asked them to try something like this:
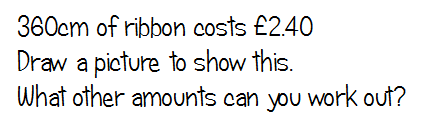
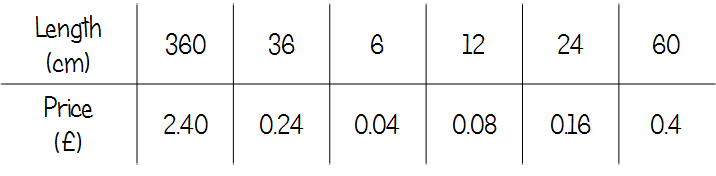
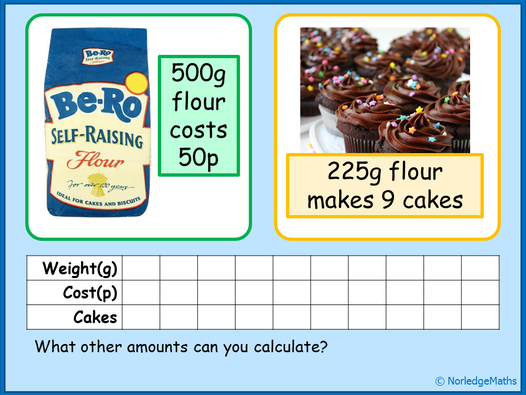
This context was deliberately designed to cause problems with the bar model. Many pupils struggled to accurately show such a large amount, and it quickly became unwieldy to split up into useful fractions. Once they’d had a go, I introduced using a ratio table and just got them to fill in any useful amounts they could. These are just a few examples – we were actually going for quite a while with this!
As I mentioned in my post about using this for percentages, there’s a lot of flexibility here in terms of ways to work towards a final answer (if asked to find one).
We spent a lot more time messing around with other proportion problems using ratio tables. I wasn’t trying to get them to find an answer at this point; the goal was more to work with the numbers and get a feel for correctly sized and useful amounts. Many of them decided that dividing by 10 was a useful thing to do, which bodes well for further work on percentages.
Once we’d done a few where I just let them work out whatever they wanted, we discussed the most useful building blocks to find. We agreed that finding “one” of something was really useful, as you could quickly get any number from there.
We spent quite an interesting lesson playing around with ideas of three things related by proportion, and what division calculations could represent.
I got them to work with a ratio table with three columns, and just asked them to fill in any amounts they could find. By this stage, they were fairly confident with finding “one” of something, then using this to work out other amounts.
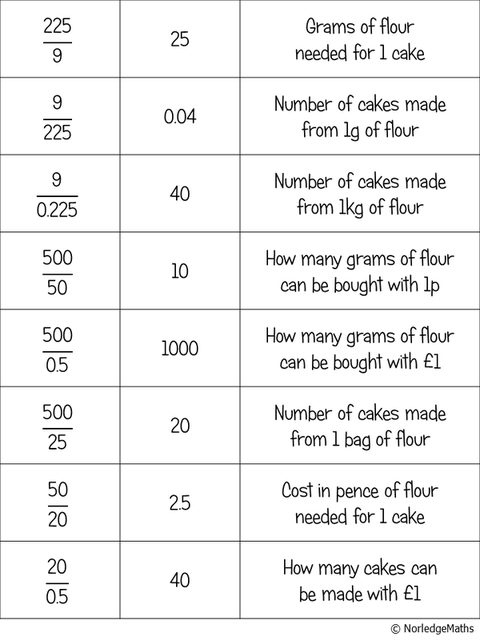
I then gave them a little card sort to get them to think really carefully about the links between the three amounts and exactly what each division calculation represented.
We had quite a powerful discussion about what “finding one of something” really meant in this context and emphasised exactly which way round the division needed to happen to find out whatever they needed. We talked quite a lot about “cost per cake” being a clue as to which way round to divide the numbers.
Towards the end of the lesson, I gave them the GCSE problem I based the card-sort on. They found it very straightforward.
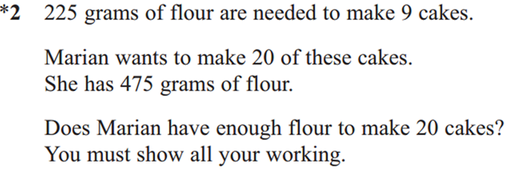
Interestingly, some of them approached the problem by working out how many cakes she could make with 475g of flour, while some worked out how much flour she would need for 20 cakes.