Bar modelling

Proportional reasoning on Edexcel June 2015 P1

I’ve written quite a few posts recently aboutย using ratio tables extensivelyย in my teaching for proportional reasoning. Following the explosion on Twitter about Edexcel’s non-calculator paper last Thursday, I thought it might be time for a critical evaluation on my part of just how useful (or not!) they are in tackling any or all of the proportional reasoning problems on the most recent paper, particularly if we should see this as an indicator of things to come, as @El_Timbre suggested in thisย brilliant blog postย on Sunday.ย 

I’m approaching this from the point of view of pupils aiming for a grade C, as I’ve had borderline groups for the last two years, and no top GCSE sets for about four, due to having plenty of A Level Maths on my timetable already, so I’ll admit that my pedagogy and knowledge of grade A/A* topics at GCSE is fairly limited.

Q1b Percentages from a stem and leaf diagram

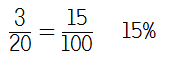
I posted about how useful Year 11 found ratio tables for converting fractions to percentagesย back in May, and I was happy that at least three pupils mentioned to me after their exam that they’d used this strategy on this question to get the correct answer.

I’m still pretty convinced on dealing with fraction to percentage conversions with ratio tables, but I can see that it might be a little unnecessary here. I’d like to think that once pupils had got the fraction 3/20, they would spot that 20 goes into 100 five times and multiply the numerator accordingly.

Q4 Plant comparisons

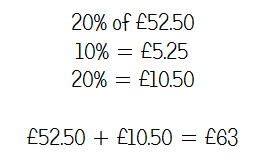
Overall, I thought this was a nice little problem-solving question. It involves pupils working out a percentage, then deducting this from the total cost. Again, I know that most of my groups have found ratio tables useful for structuring their working out, but 20% is a fairly simple percentage, so I can see some pupils not bothering.

Q9 John’s conference

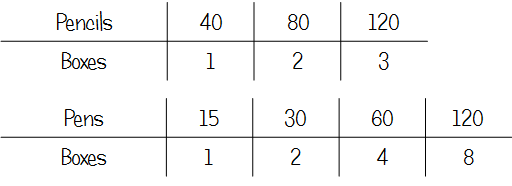
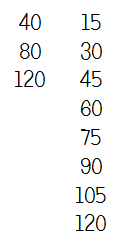
As the Twitterverse astutely observed, why not get people to bring their own pencils? However, assuming John doesn’t want to put people out, this was a fairly straightforward LCM problem. I quite like the ratio table approach here as it tidies up listing the numbers somewhat, and might avoid any silly errors with miscounting the number of boxes at the end. It also allows pupils to double up to 8 boxes of pens without having to write down each number up to 8 x 15, again eliminating potential for slips in calculations.
Q10 Mary’s conservatory

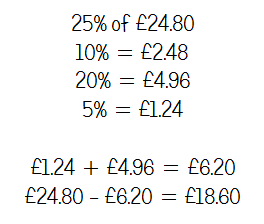
I’ve been trying to encourage my Year 11s to scrape every single mark on the Higher paper, and split problem-solving questions where possible. Many of these area/problem solving questions include a percentage calculation that can be done without needing to find the area first. 

In a similar vein to the plant comparison question, the only benefit of a ratio table here is structuring working out – I don’t think it adds anything in terms of making the calculation more straightforward.

Q11 Karl’s game

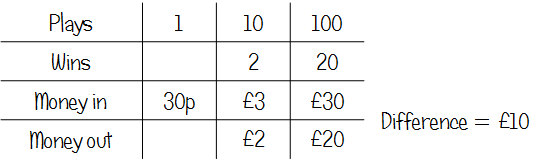
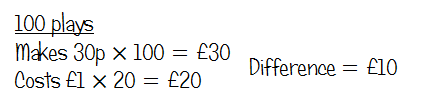
Again, a table offers a bit of help in terms of structuring working out here. If pupils get used to constructing these for themselves, it’s conceivable that they’d find this useful to put in what they know, then work out anything else that they can. It might help them to make the link between 10 plays in part (a) and 100 plays in part (b).
Q14 Raksha’s journey

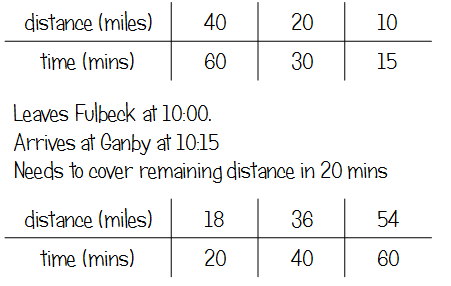
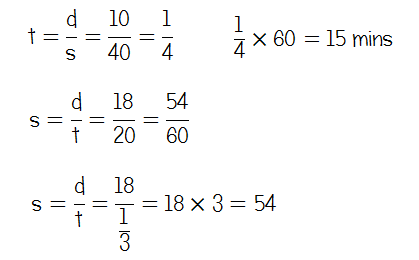
This is the first question I met that really convinced me that a ratio table was the superior method or way to structure working. From conversations with pupils (and reading on Twitter), I know that those who applied the sdt formula got really confused with units – there needs to be an appreciation that the time is given in minutes but speed given in miles per hour. Structuring using a table kind of avoids these errors in the first part of the calculation, and makes it clearer to see what you need to do in the second part to get an answer in miles per hour.ย 

Q15b Does the point lie on the line?

This question pulled me up short a bit – I’ve avoided this with my Year 11s this year in favour of cherry-picking easier marks – but when I was doing the paper, I immediately used the “A Level” formula y – y1 = m(x – x1). I went back and checked over the current and new GCSE syllabi, and finding the equation of a line given two points seems to be listed as new spec only, but, as I said at the top, I have limited experience with teaching A/A* topics and related pedagogy.
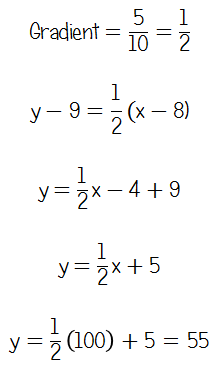
According to this site, it’s a new topic coming to Foundation and Higher, so there are obvious implications for teaching next year.

Chatting to a few pupils in top sets, many of them either found the gradient, then substituted in one point to find the y-intercept, or, overwhelmingly, used a sketch.

A colleague suggested that the approach she had used was getting them to work out the gradient from the two points, then work out if the third point gave the same gradient.

However, I started to think about making this question accessible for borderline pupils who (let’s face it) won’t have as developed algebra skills as those aiming for As or A*s.
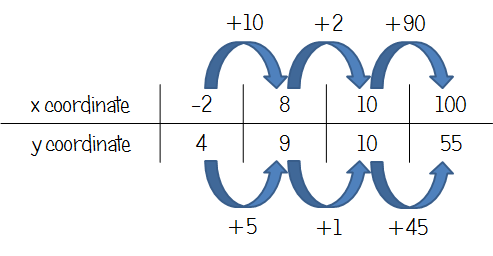
Now, obviously this isn’t really a “ratio” table, as we’ve got a linear relationship, not direct proportion. However, if we look at the change in x and change in y for the two points we’ve been given, it’s clear that the increase in x is double the increase in y. 

From here, it’s not too difficult to get from 8 to 10 and then 10 to 100 with the x coordinates, resulting in a y coordinate of 55, proving that the point (100, 56) is not on the line.

Whether or not this is an acceptable way to “show how you work out your answer” remains to be seen!

I’m not meaning this to be a passionate argument for the use of ratio tables – they work really well with some pupils for basic percentage calculations, and (I think) have stopped some of mine from just panicking in an exam and working out “something”, then going from there. I think use for SDT and DMV may prove really useful, particularly for those that struggle to rearrange formulae.

What do you think? Drop me a comment below!

Proportional reasoning on Edexcel June 2015 P1 Read More ยป

Exploring proportional reasoning

Tonight’s post is another quick one about using ratio tables, this time for solving proportional reasoning problems. I’ve previously blogged about using them for percentage calculations and converting fractions to percentages, so thought that a post on general proportional reasoning was long overdue! Note: The ideas detailed in this post took a good few lessons to work through, and we supplemented the discussions with lots of related practice. 

By the time I got to proportional reasoning in our scheme of work this year, my classes had already had quite a lot of experience in using the bar model for solving fraction problems. I started off by working through one of the superb lessons I had from the NCETM last year, which looks at proportional reasoning using a bar.

Picture

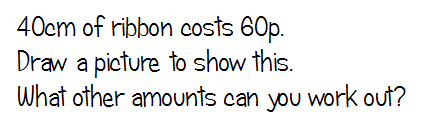
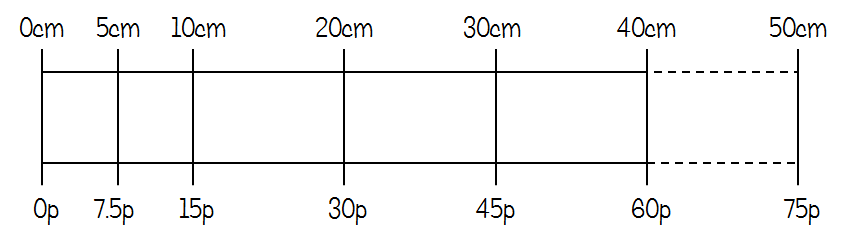
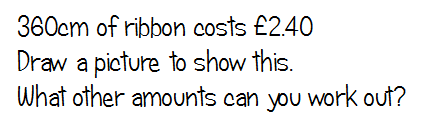
We started off with a prompt about buying ribbon. The context was deliberately chosen to encourage pupils to use a bar diagram, and many of them competently worked out lots of different amounts. With a little prompting, they thought a little further and realised that they could also extend the bar to find amounts greater than 40cm.

Picture

Once we’d played around with these ideas for a bit, including doing lots more diagrams for different ribbons with different prices and amounts, I asked them to try something like this:

Picture

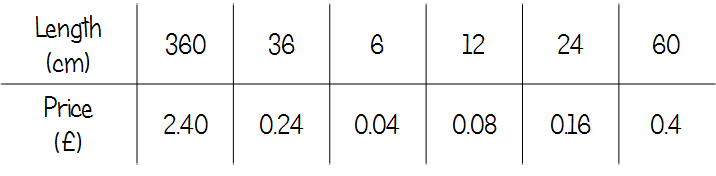
This context was deliberately designed to cause problems with the bar model. Many pupils struggled to accurately show such a large amount, and it quickly became unwieldy to split up into useful fractions. Once they’d had a go, I introduced using a ratio table and just got them to fill in any useful amounts they could. These are just a few examples – we were actually going for quite a while with this!

Picture

As I mentioned in my post about using this for percentages, there’s a lot of flexibility here in terms of ways to work towards a final answer (if asked to find one).

We spent a lot more time messing around with other proportion problems using ratio tables. I wasn’t trying to get them to find an answer at this point; the goal was more to work with the numbers and get a feel for correctly sized and useful amounts. Many of them decided that dividing by 10 was a useful thing to do, which bodes well for further work on percentages.

Once we’d done a few where I just let them work out whatever they wanted, we discussed the most useful building blocks to find. We agreed that finding “one” of something was really useful, as you could quickly get any number from there.

Picture

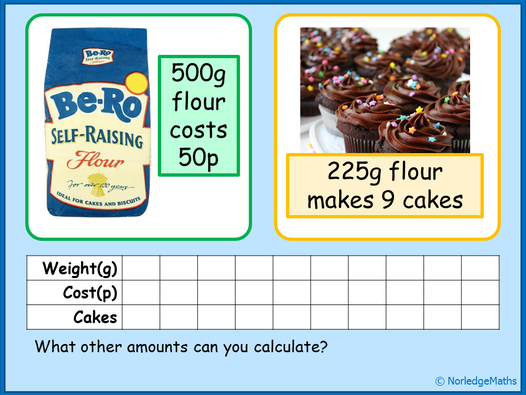
We spent quite an interesting lesson playing around with ideas of three things related by proportion, and what division calculations could represent.

I got them to work with a ratio table with three columns, and just asked them to fill in any amounts they could find. By this stage, they were fairly confident with finding “one” of something, then using this to work out other amounts.

Picture

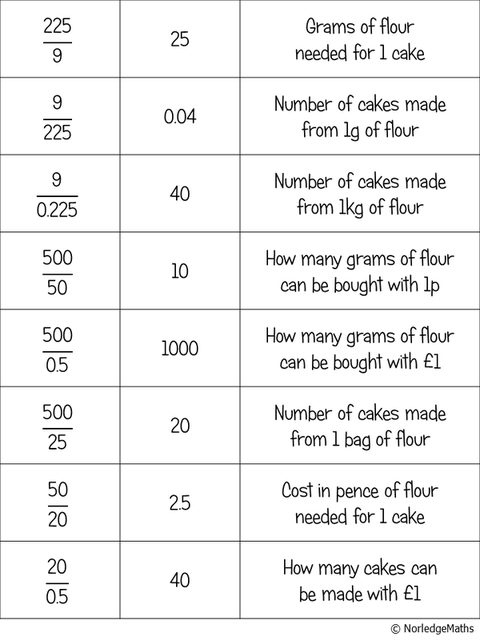
I then gave them a little card sort to get them to think really carefully about the links between the three amounts and exactly what each division calculation represented.

We had quite a powerful discussion about what “finding one of something” really meant in this context and emphasised exactly which way round the division needed to happen to find out whatever they needed. We talked quite a lot about “cost per cake” being a clue as to which way round to divide the numbers.

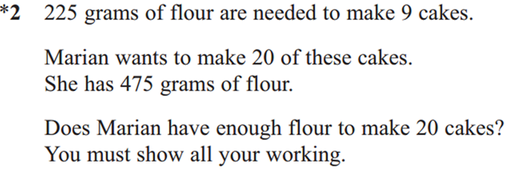
Towards the end of the lesson, I gave them the GCSE problem I based the card-sort on. They found it very straightforward.

March 2013 Paper 2H (C) Edexcel

Interestingly, some of them approached the problem by working out how many cakes she could make with 475g of flour, while some worked out how much flour she would need for 20 cakes.

Exploring proportional reasoning Read More ยป

Fraction and percentage equivalence using ratio tables

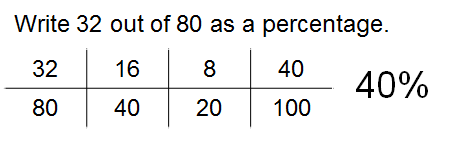
It seems that two years of shameless use of ratio tables have finally paid off; I saw three of my Year 11s independently tackle a non calculator percentages question like this today:

Picture

I’m not sure exactly how I would have taught this before I discovered ratio tables; I suppose just pray that they noticed a common factor of 8 in the numerator and denominator to get them to 4/10, then realise that they need to multiply numerator and denominator by 10 to get 40/100. 

I’ve previously blogged about how useful I’ve found ratio tables for percentages of amounts, increases and decreases. but I’ll also be adding this permanently to my repertoire for fraction and percentage equivalence from now on. It’s incredibly helpful for those pupils who just refuse to look for factors other than 2!

If you fancy giving it a go, you may be interested inย this worksheet:

Fraction and percentage equivalence using ratio tables Read More ยป

From bar modelling to ratio tables – tidying up percentages

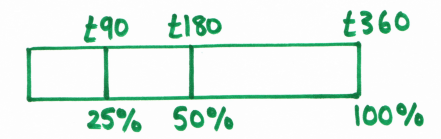
It’s no secret that I’m a big fan of bar modelling to get pupils to really think about the calculations they are doing. It’s a great way to introduce work with percentages too, and solidifies the link between percentage and fraction calculations. One particular advantage is the flexibility it affords – I had one pupil decide that the best way for her to find 15% was to work out 25% and 10%, then subtract one from the other, rather than the more “traditional” method we’d probably all teach of finding 10% and 5%, then adding together.Here’s 25% and 50% of ยฃ360 on a bar – easily found by halving and halving again.

Picture

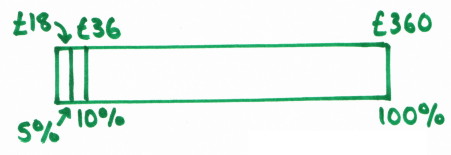
However, although I use bar modelling when introducing new concepts with percentages, once pupils have drawn enough bars to get the ideas, I then push them on to using ratio tables for calculations instead. The bar’s great for larger percentages, but once you get down to the useful building blocks like 10% and 5%, the left hand side of the bar starts looking very messy indeed. And you can forget trying to show 1% on a bar with a suitable scale for exercise books. Here’s 5% of ยฃ360 on a bar:

Picture

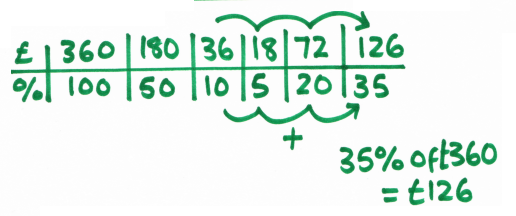
Now here’s a ratio table using ยฃ360 (I decided to find 35% in this example):

Picture

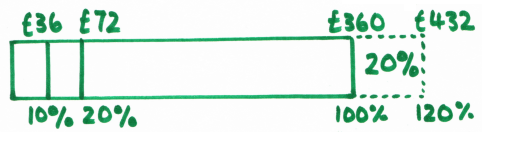
I love using these as the flexibility of the bar is preserved; pupils can still approach problems from different angles and, if they can’t see a clear route through a problem, they can at least work out some amounts to see if that helps. You can see that, although I’ve chosen to find 10%, 20% and 5% then add together, it would equally be fine to work out 30% from 3 x 10%, then add to 5%, or even work out 15% and subtract this from 50%, and some great classroom discussions come out of the different approaches pupils have used.Here’s a bar for ยฃ360 increased by 20%:

Picture

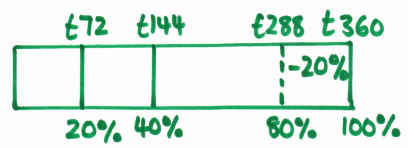
Bars are brilliant for encouraging pupils to think about the idea that increasing an amount by 20% is the same as finding 120% of something, which is useful for further work on percentage multipliers.And here’s a bar for ยฃ360 decreased by 20%:

Picture

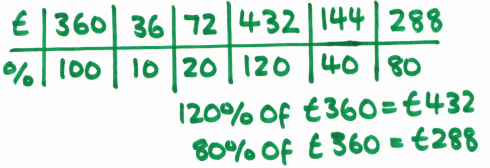
Again, you can see the link between a 20% decrease and finding 80% of that amount.It’s worth being very careful about how quickly you move away from bar modelling with percentage change problems; pupils need to be really confident with what 100% means in the context of the problem. However, once they’re fine with that, here’s a ratio table for ยฃ360, with both a 20% increase and 20% decrease shown:

Picture

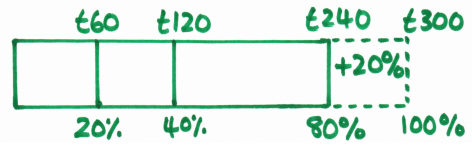
The next logical step is reverse percentages – finding the original price if you know the increased or reduced price. Here’s a bar for an item costing ยฃ240 with a deduction of 20%:

Picture

Because there’s so much scope for confusion with these, I’d spend a lot more time using bars with pupils until I’m satisfied they can satisfactorily distinguish between these and standard increases or decreases. The bar has a distinct advantage here that it’s more difficult to make the mistake of dividing ยฃ240 by 10 to get 10%, because it’s more intuitive to work down in halves.

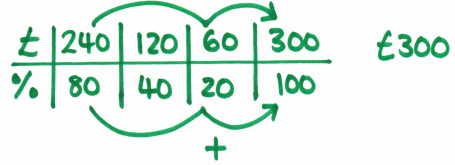
Here’s the ratio table:

Picture

Because ratio tables are quick and easy to draw, I encourage them in exam situations for non-calculator problems, particularly for those pupils who get lost in their working out and tend to just scribble their calculations all over the page.

Ratio tables are also fantastic for other problems, such as all the proportion stuff like currency conversion. There’s also a direct link to proportion graphs, as you’ve got your table of values to create the graph straight away.

From bar modelling to ratio tables – tidying up percentages Read More ยป

Introducing fraction arithmetic (2)

This is part of a series of blogs on my favourite way to teach adding and subtracting fractions in a way that sticks and really develops understanding of the process.

Lesson 2 – The importance of equal-sized bars

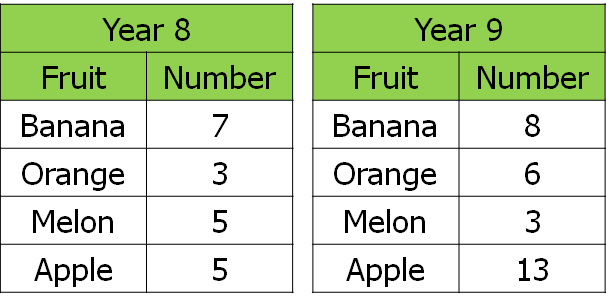
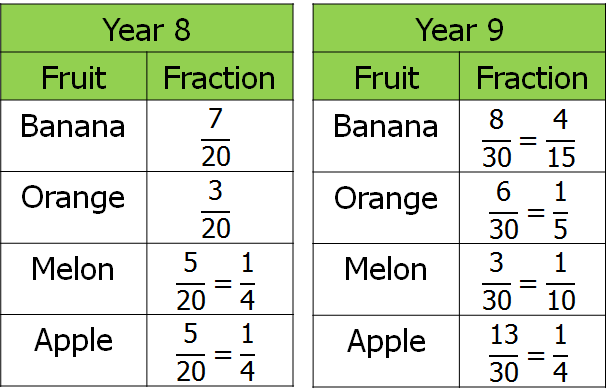
At the start of the next lesson, present pupils with two more sets of data, this time comparing two groups of unequal size. Using group sizes of 20 and 30 are particularly effective.

Picture

I usually get the class to first represent both sets of data on two more bar diagrams using the template from the previous lesson and get them to record the fractions of Year 8s and 9s that preferred each fruit, cancelling down to the simplest form.

Picture
Picture

I then ask something like “are oranges more popular in Year 8 or Year 9?” and get pupils to discuss this idea in pairs for a couple of minutes, then share as a whole class. Pupils come up with some interesting points at this stage, and it’s useful to have a discussion about what the numerator and denominator of each fraction tells us. I get them to think about making a comparison and why it’s a problem to compare two bars of different sizes.

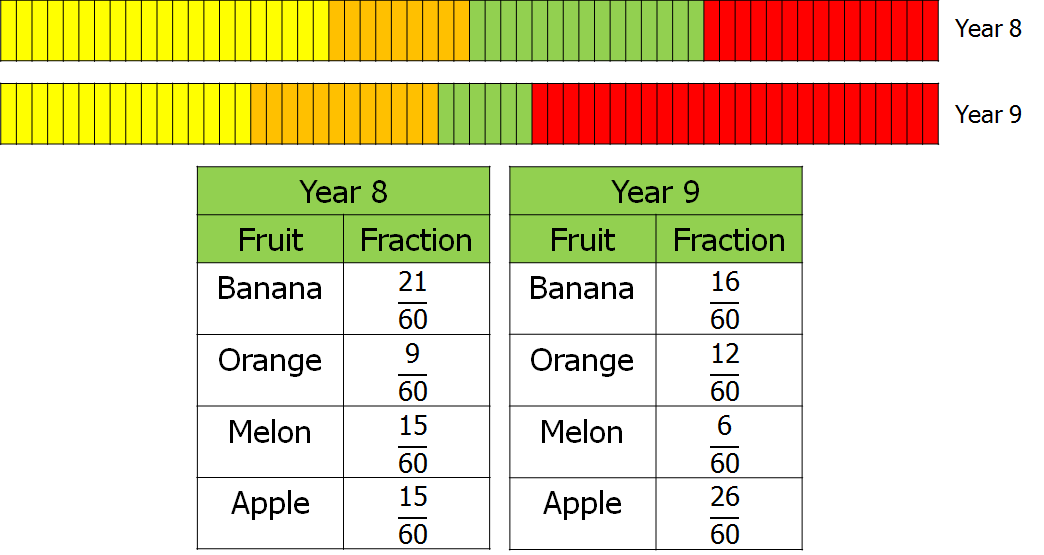
Eventually, someone will come up with the idea of using equal sized bars, and they usually spot that the most sensible number to use here is 60. We’re starting to develop the idea of common denominators, although I’m not using that language at this stage. They then draw the equal bars and produce the fractions tables again.

Picture

Usually, the rest of this lesson is then spent working on questions like:

  • What is the difference between the number of pupils who liked bananas in Year 8 and 9?
  • How many pupils in Year 9 liked either oranges or melons?

These develop the ideas of adding and subtracting as totals or differences, allow pupils to compare these amounts on a bar, and reinforce the idea that you don’t add the denominators. 

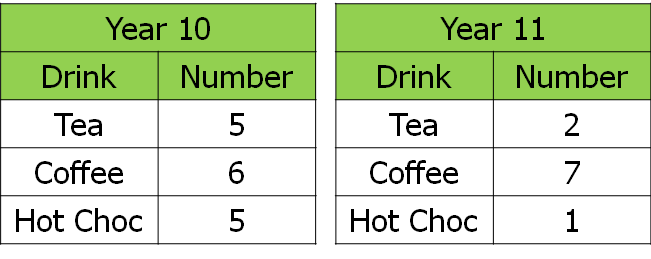
Depending on how I feel pupils’ understanding is developing, I might then give them another set of data such as this one:

Picture

I get them to suggest possible bar lengths for Year 10 and 11, and a bar length that could be used to compare the two. If I feel they need more practice working with concrete examples, I get them to draw their own bars using the squares in their exercise books, and make similar comparisons. 

Something that’s really important when working on lessons or tasks which enhance understanding is not to push too hard at a final goal, but to assess and allow pupils to develop at a rate appropriate for them. Occasionally I have left this next step to the next lesson, set it as homework, or (with pupils whose understanding is developing quickly), ask them to do this straight away without bars.

Introducing fraction arithmetic (2) Read More ยป

Introducing fraction arithmetic (1)

The lesson(s) detailed below have been absolutely groundbreaking for me in terms of teaching adding and subtracting fractions in a way that makes the topic stick and that pupils really understand. The ideas behind it were introduced to me as part of the NCETM’s Multiplicative Reasoning course (previously mentioned in my blog about bar modelling). Unfortunately, while I have the lesson materials, I’m still unsure about their status in terms of sharing – they were presented to us as trial materials, with the suggestion that they would be available to schools nationwide once the project had finished, but I can’t find them anywhere on the NCETM’s website (yet). So although I can’t post a link to the PowerPoint and lesson materials I’m using, I thought I’d pop up a quick blog about the ideas behind the materials.The lesson was titled “Our survey said…” and formed part of a sequence of lessons about fractions. The previous lesson was along the lines of this one on sharing cakes, and got pupils to explore using rectangular models to represent fractions. This lesson continues the themes explored there, although it doesn’t look like it from the outset!

Lesson 1 – Developing understanding using pie charts

The lesson begins with an explanation about a school canteen worker who wants to ensure that she is buying the right amounts of different types of fruit and vegetables to cater for the pupils in her school, so she surveys them about their favourite types of fruit and veg. After a few minutes of discussion around this, I then explain to pupils that we are going to do the same thing, and find out what our results look like. I did this last week with Year 7, so I’ll use their results for illustration purposes.

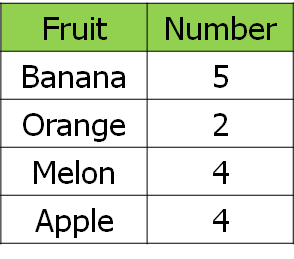
First of all, I got them to vote for their favourite fruit. It’s worth “fiddling” the results a little bit here to give a useful denominator – I added myself into the survey so that we were working with fifteenths rather than fourteenths, as I wanted to get away from the idea that simplifying fractions only involves continual halving. Here are our results:

Picture

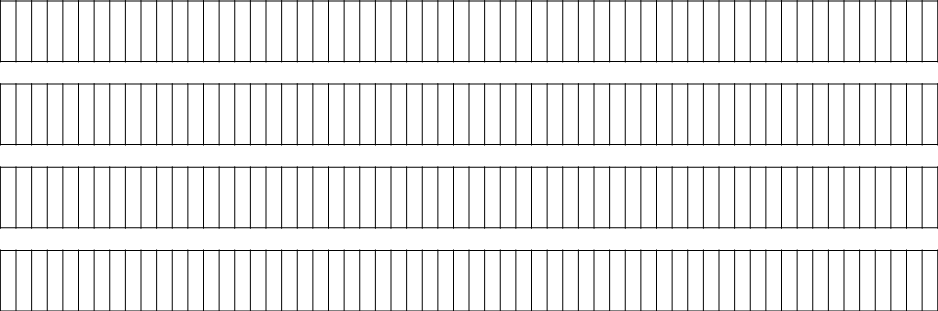
I provided pupils with these premade bar diagrams (on card) and asked them to produce a bar model of our results. For reference, there are 60 segments per bar – most flexible in terms of further work.After a couple of minutes of colouring in, pupils had produced something like this:

Picture
Picture

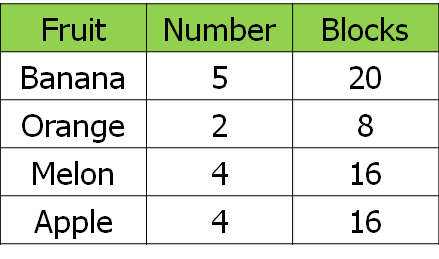
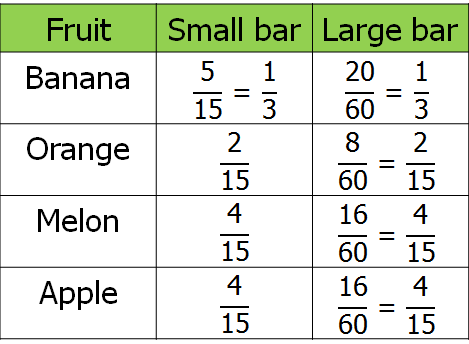
Together we worked out how many segments we would need to shade in for each type of fruit:

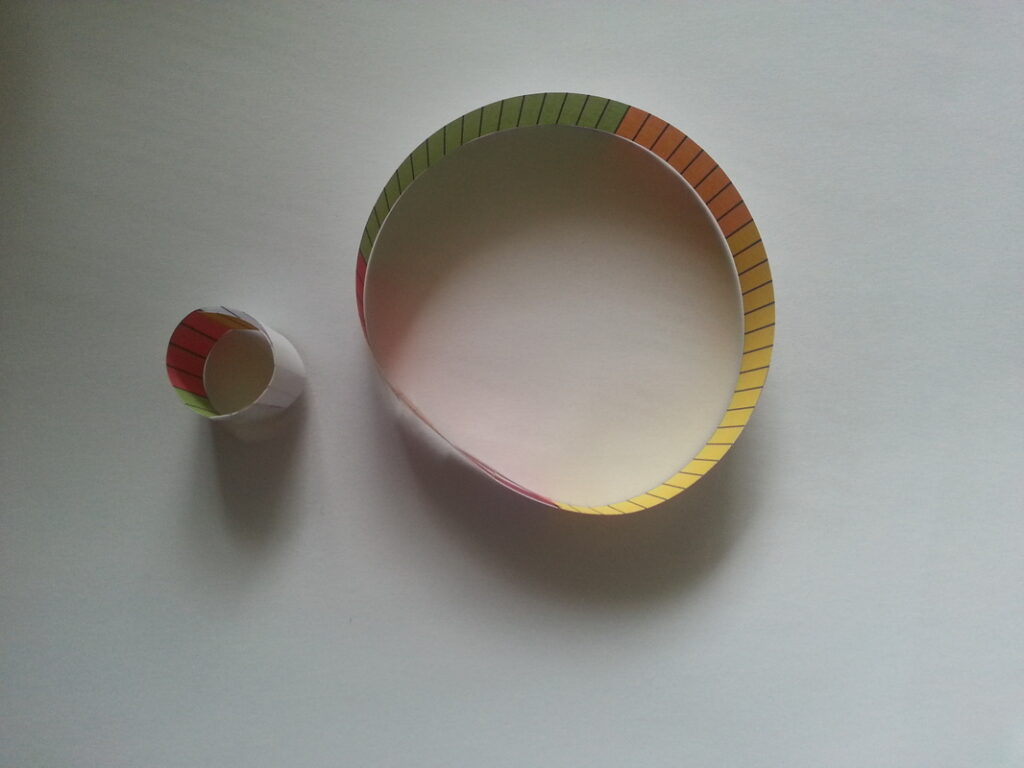
Creating a pie chart with small and big bars.

The original lesson then gets pupils to cut out their bar, turn it into a circle with a paperclip and use this to create a pie chart. There’s then a lot of scope for discussion in terms of links between the two models, such as the fact that it’s clearer to see that (in this case) 1/3 of the class preferred bananas. Now, normally I get pupils to do this with their small bar first, before moving on to the next stage. However, the relatively small size of my class gave me a bit of inspiration – I demonstrated with my small bar what I was going to get them to do, and hammed up the fiddling around a little bit – “Oh, it’s going to be so difficult to do this with this tiny bar… how can we make it easier?”.ย It didn’t take long for one bright spark to suggest that we used a larger bar with more segments for each pupil.ย 

Picture

And then they produced this, using four segments for each pupil:

Picture

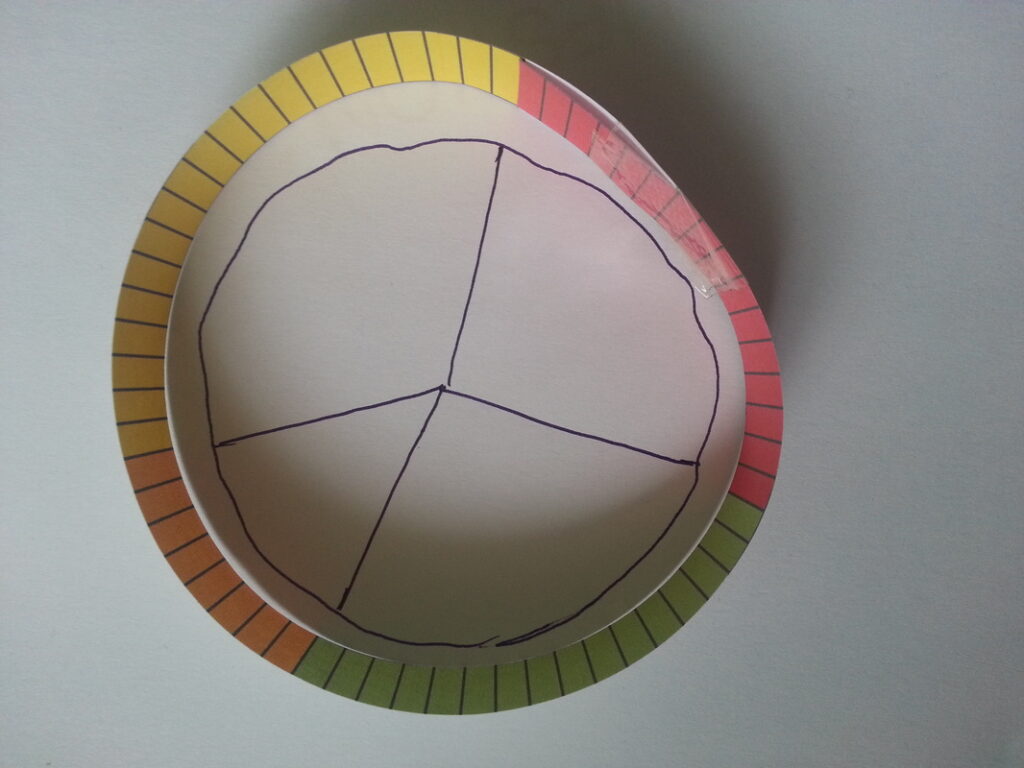
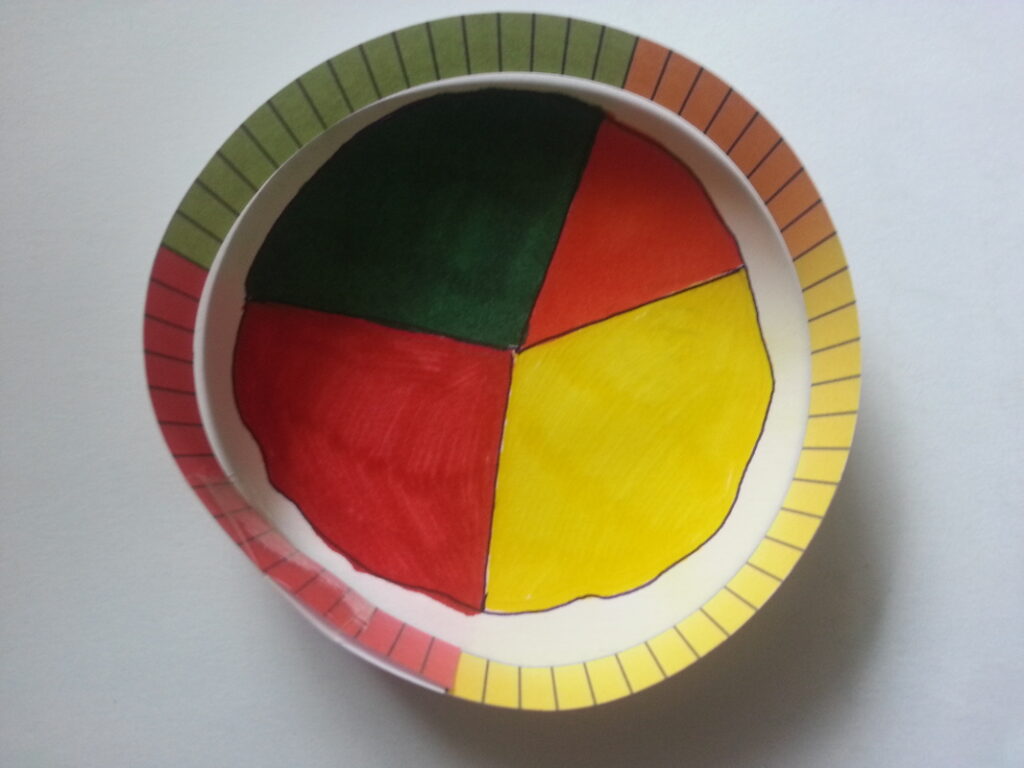
I then got them to turn their bar into a pie chart (little tip, when cutting out, leave a little bit of card on the end of the bar to make it easier to fix the two ends together). Check out the pics below to see the process.

Draw a circle using the inside of the bar. Mark the intersections, then join to the centre point.
Colour code the pie chart using the same colours as the bar.

After discussing what their pie charts showed, we then got into the fractions stuff. We came up with fractions for our small and big bars, then looked at the equivalence of these fractions.

Picture

To finish the lesson off, we linked the work we’d done this lesson with fraction of amounts calculations by scaling our results up for a group of 300 pupils and working out how many of each fruit should be bought for a group this size.

Introducing fraction arithmetic (1) Read More ยป

Bar modelling – reflections on Celebration of Maths 2015

I’ve been using bar modelling quite extensively in my teaching since being involved with the NCETM’s multiplicative reasoning project last year. Part of the project was to emphasise the importance of diagrammatic representations of problems in teaching maths for understanding; we were given materials to deliver to Key Stage 3 classes, some of which included use of Singapore bar modelling for topics such as fractions, percentages and ratio. I found the work we did really altered my teaching; I think that I managed to teach addition of fractions successfully for the first time since I started teaching, and I was amazed at just how well my students retained efficiency and accuracy with “traditional” written methods.

It seemed like a bit of a no-brainer to pick the bar modelling workshop at the Celebration of Maths, so I and my colleagues trotted along to the session, sat down with our mini-whiteboards and got ready to draw some bars. One thing I was really keen to get out of this session was to iron out some issues I still had with using the bar to solve problems with negative amounts, and I was still struggling to see how to apply bar modelling to exam technique (see my attempt with the Edexcel SAMs here).

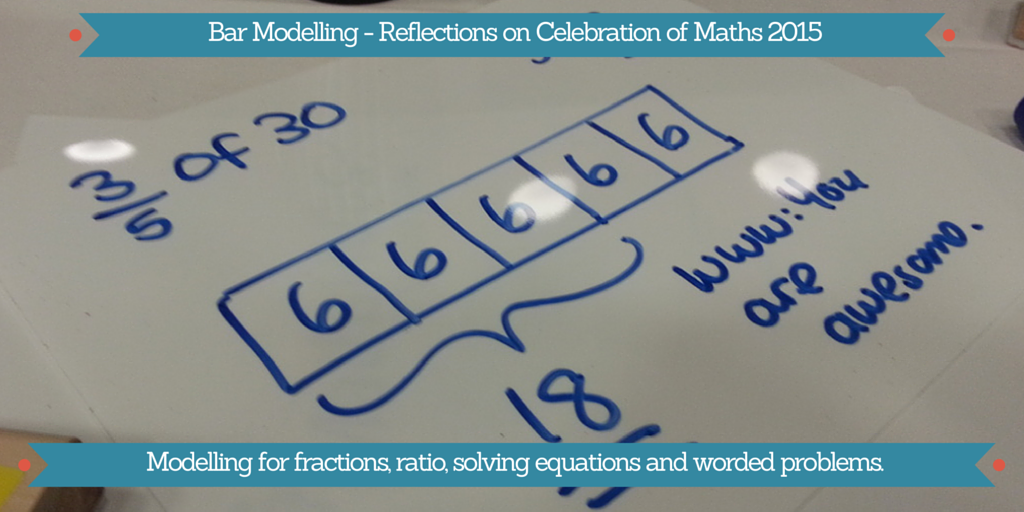
First of all we looked at some simple problems, like fractions of amounts. I’m already pretty happy with this – there are plenty of examples of stuff like this in my Year 7’s books at the moment. I was so proud of myself that I thought I’d add a really constructive “what went well” to my work too.Using a bar model to find 3/5 of 30.However, something I’d not thought of consciously is the importance of getting students to also write down the calculations they are doing. You can see in the picture I’ve written down that I did 30 รท 5 to get 6 for 1/5 of the whole amount, but I rarely get students to do this at the moment. I’ve noticed that some students naturally move away from drawing a bar once they have done a few problems and can “see” what’s going on, but I’m going to enforce writing of calculations too from now on, in the hope that more of them will be able to make this step.

Something else that I realised was that I’d been thinking about bar modelling all wrong; it’s a tool for developing understanding, not just “another method”, and I’m aware that, in some cases, I’ve been treating bar modelling as a method (again, see my struggle with the SAMs). This session really clarified in my mind that the bar isn’t a replacement for traditional methods in terms of efficiency, and I really shouldn’t hold back students who already understand by insisting they use bars all the time; it’s more of a stepping stone to get them to understand and think critically about the calculations they are doing, so they can move from concrete/pictoral representations to being able to solve the problems using “just numbers”.

Next up, we looked at equations. I developed and trialled a load of algebra tiles resources of the back of the NCETM project last year, which have been quite successful. I’ve not taught solving equations from scratch yet this year, but I’m planning on marrying up the work with algebra tiles and bar modelling. Rather than actually do the problems in the presentation, we decided to have a heated discussion about how to deal with negatives in equations instead (yes, like those annoying kids who don’t pay attention to what’s actually going on!).

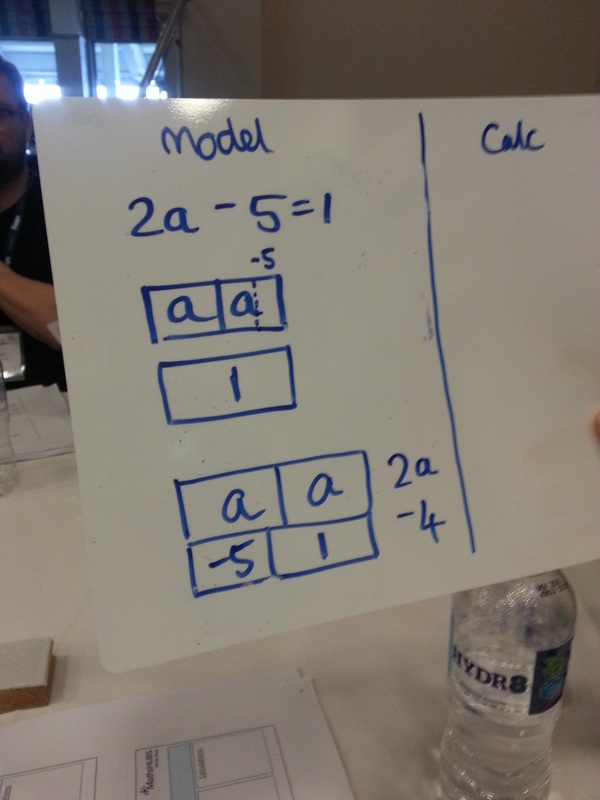
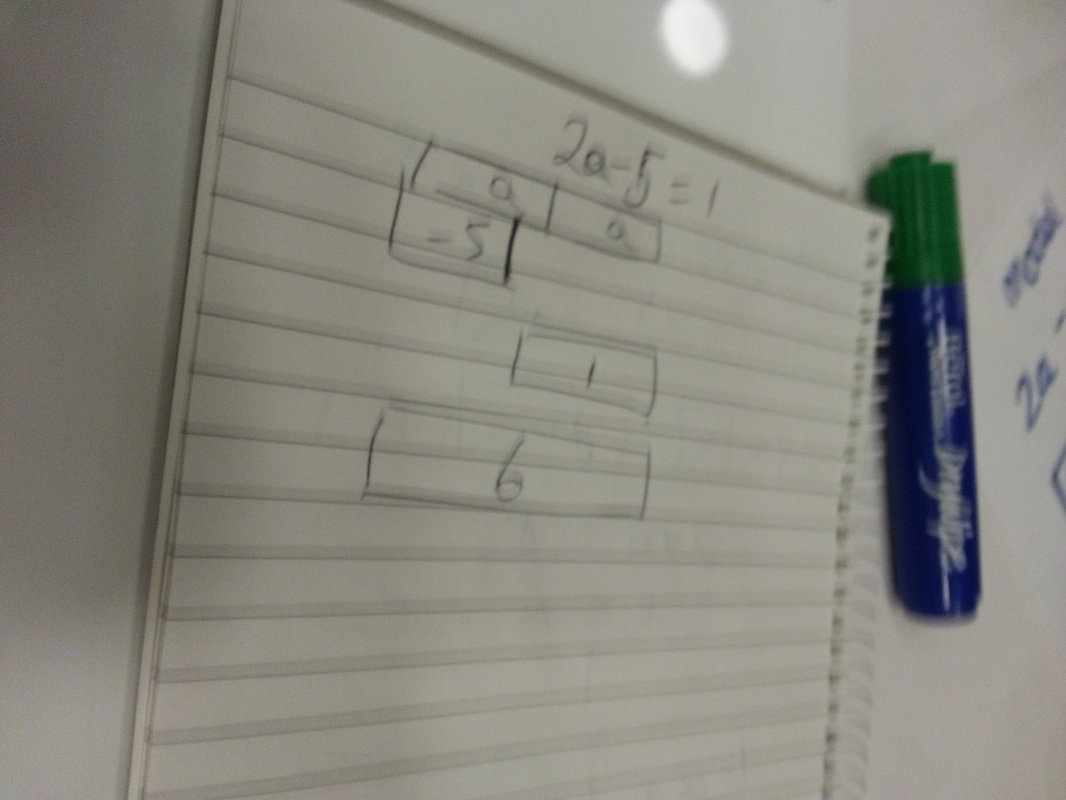
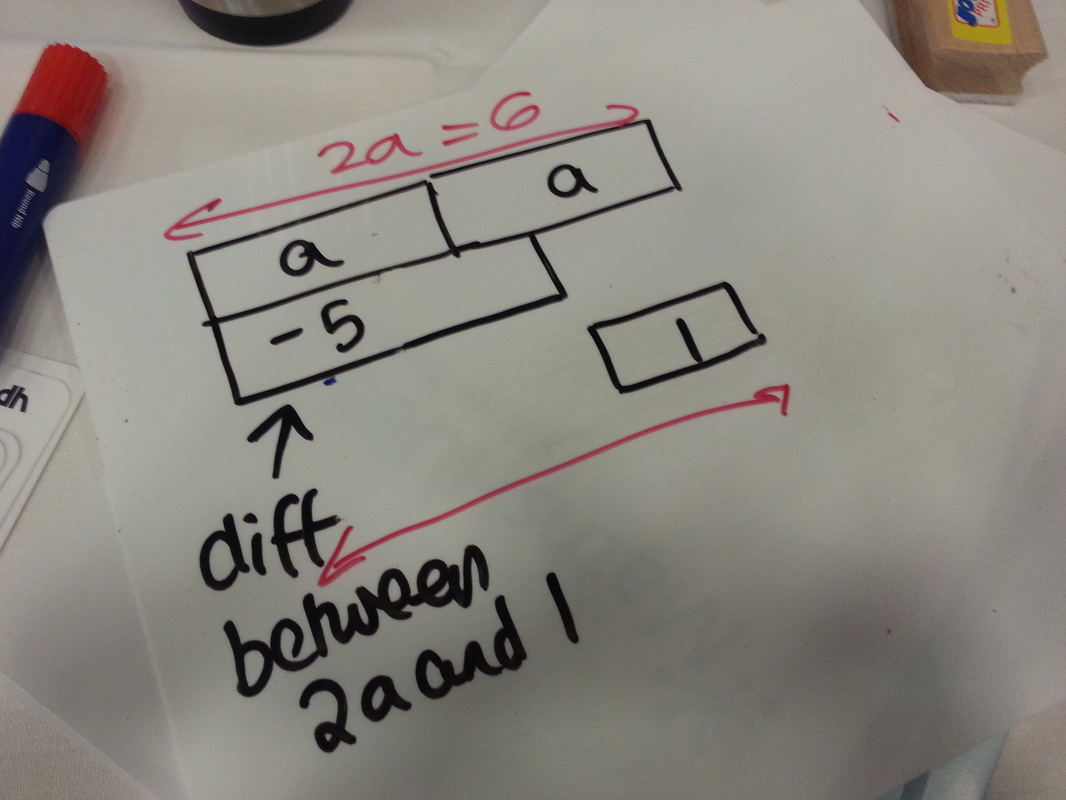
Here are our thoughts and diagrams for 2a – 1 = 5. We really struggled to get our heads around how to represent a negative amount or subtraction on the bar!

Picture
PicturePicture

We finally cracked it (kinda) with the second and third diagrams. If you think about the equation as “the difference between 2a and 5 is 1”, then you can show this using blocks. I’m still not sure whether or not I actually want to put a negative sign with that 5. You can then see that 2a = 6 and deduce that a = 3.

This took quite a while, and caused a lot of hurty heads! We concluded that bar modelling was really useful when introducing solving equations, if done with positive numbers and solutions, but that working with negative amounts or subtractions is much simpler with algebraic representations.

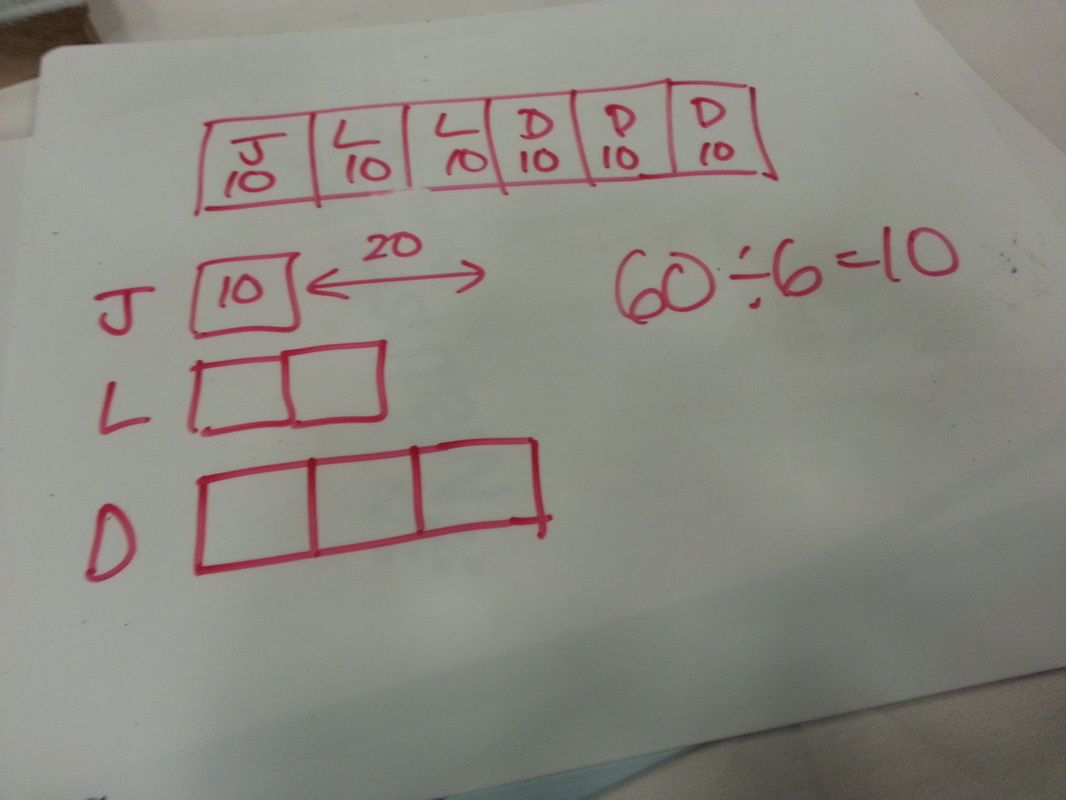
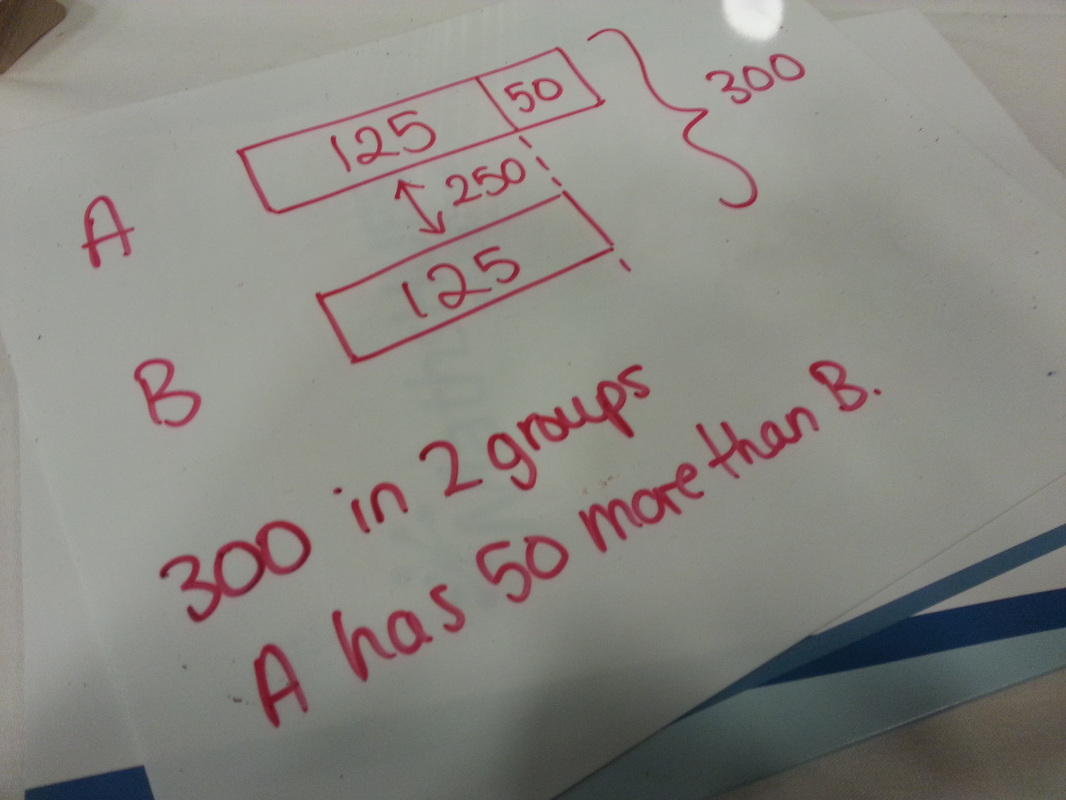
We then had a look at some ratio problems. I commonly use one big bar to represent the whole amount, marking on the people with letters or similar, and then showing one share (top diagram). However, in the workshop we did this by drawing three separate bars, one underneath the other (bottom diagram).

Picture

I think both representations have their merits. Using one big bar links more easily into fraction/ratio equivalence and finding fractions of amounts. I’ve certainly had a lot of success in getting students to understand and do ratio problems using this. However, in problems where the difference between two people’s shares is important, I can see how separate bars make it easier to compare or find differences.

The problem for this diagram was something along the lines of:

There are 300 students in two groups, A and B. A has 50 more students than B. How many in each group?

Picture

This was a great example of when a bar model would probably be one of the most efficient ways to solve this quickly.

The biggest thing I got out of this workshop was that the bar model is not just another method to get students to pass exams. For most exam questions, it’s probably fairly inefficient, although I’d like to hope that with enough work on bar modelling, it might mean that students can try to tackle problems even if they are unsure of exactly what the question is asking. However, it really should be embedded in our maths curriculum as a powerful tool for developing understanding and as a stepping stone from concrete to abstract. 

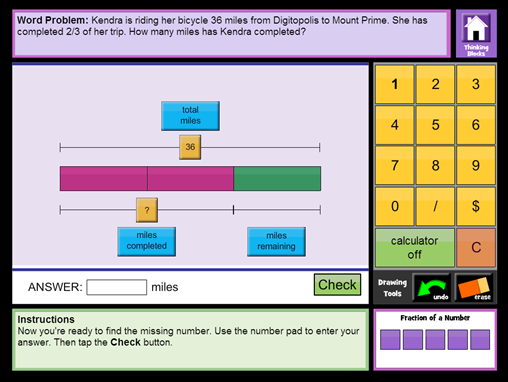
One last thing mentioned wasย Math Playground; I’ve had a quick look and they have some great tools for creating and solving bar model problems. Here’s one I made earlier:

Picture

Bar modelling – reflections on Celebration of Maths 2015 Read More ยป

We’re going on a bar hunt

Excuse the pun, I’m just quite excited about the Celebration of Maths event tomorrow. Due to the fact that I’m going to the bar modelling session tomorrow (and that I’m a geek who loves doing Maths on a Friday night), I decided to go on a bar modelling hunt using the Foundation paper 1 from the Edexcel GCSE 9-1 Sample Assessment materials.

As a side note, this is the first time I’ve sat down and properly worked through any of the new SAMs… and man, they are hard! It will be interesting to see what comes out of the Ofqual stuff in the next few months. But regardless, I’ve gone through and picked out all the questions that (I think) could be done using bar modelling. The last hour has made me re-evaluate my ideas about bar modelling as the absolute best thing that’s happening in maths teaching – don’t get me wrong, I’m loving it for developing understanding while teaching new concepts, particularly for fractions and ratio, but I’m more convinced that there’s still a place for “standard methods” than I was six months ago.

Anyway, here are some mathematical scribblings and ramblings. Due to copyrighting etc, I’m not reproducing any of the original materials on here, so you might want to open a copy of the paper too.

Question 1d ~ Percentage of amount (2 marks)
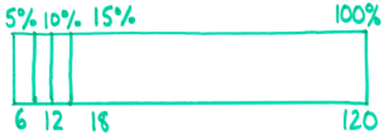
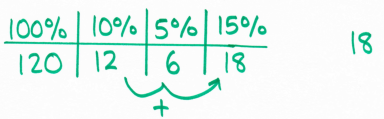
Nice, straightforward percentage question – find 15% of 120. Here’s my bar model:

Picture

I decided a while ago that I dislike using a bar model for percentages. It’s great when introducing percentages and getting students to think about what 10% really looks like, but is pretty impractical for actually solving most percentage problems. Just look at that mess bunched up at the bottom of the bar! I suppose I could have drawn my bar a little bigger, but there’s finite room on a page.

I’d probably tackle this question with students by using a ratio table instead (thank you, NCETM). I love using these to organised calculations in proportion problems.

Picture

I like that this retains the flexibility of bar modelling in that students do not need to have a strict method in mind, and can begin the question by just finding any percentages (I’m trying to get mine to go for 10% first) and seeing what they can do with it. It’s also significantly less messy.

Question 2a – Simple multiplicative equation (1 mark)
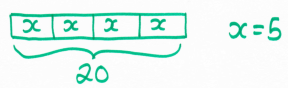
Another fairly simple question – solve 4x = 20. The bar looks like this:

Picture

I think this has some potential for students working at (current) grades G/F. For students aiming beyond this, I think the bar model is useful in establishing the ideas, but I’d be pushing towards an algebraic solution. I certainly think any student aiming for grade 4 or 5 (that sounds so weird!) would just see that without needing to draw a diagram at all. 

I’m on the fence on using bar modelling to solve equations in general. I can see some applications, but can’t get my head around how on earth you can represent equations with subtractions or negative coefficients in an intuitive manner.

Question 5 – Pictogram, metric units and proportion (3 marks)
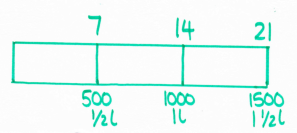
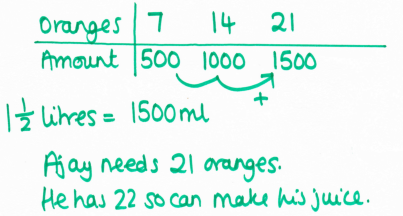
I can see students getting lost in this – there’s a lot going on! First thing they need to work out is that Ajay has 22 oranges from reading the pictogram. Then they need to realise that 1 1/2 litres is the same as 1500ml. The bar looks like this:

Picture

Students would possibly start by drawing a block for 500ml, then double to give 1000ml, then add on another 500ml. I’m still preferring my ratio table solution:

Picture

Question 6 – Fractions of amounts, proportion (5 marks)
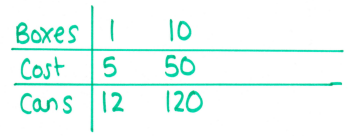
Another multi-step problem; I didn’t even try and use a bar to calculate how many cans Shazia would have – I used another ratio table, but it’s conceivable that students might just realise they have to multiply here.

Picture

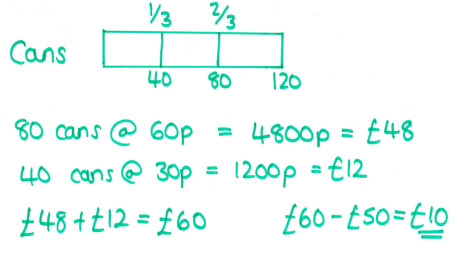
For the next step, I did actually draw a bar; a lot of my KS3 students are finding bar modelling particularly useful for finding fractions of amounts, but it remains to see how many of them will naturally stop doing that before they get to GCSE.

Picture

There’s an awful lot going on in this question!

Question 10a – Simple probability (1 mark)
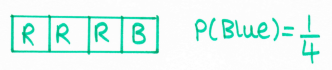
3 red beads and 1 blue bead in a jar – what’s the probability of picking a blue bead? Quite easy to draw a bar for:

Picture

I’m feeling like this might help students aiming at the very lowest grades, but that most would just go straight to 1/4 without the bar. 

Question 10b – Ratio (2 marks)
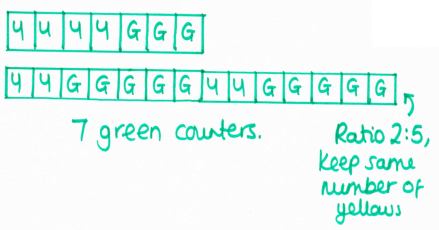
This was the first question I found that I decided that a bar model would be the most sensible way to get a solution. The first bar shows the situation at the start, then the second bar shows what happens after more greens have been added. It’s then just a matter of comparing the two bars to find how many extra greens have been added.

Picture

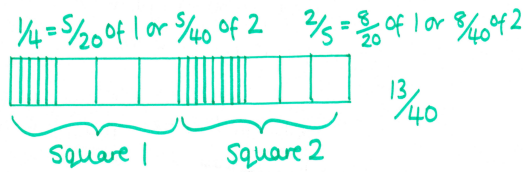
Question 11 – Adding fractions (3 marks)
This question is nasty (yes, I got it wrong the first time – turns out I don’t follow my own advice about reading the question properly). Here’s my diagram:

Picture

If students are insecure with adding fractions, I’m not sure that a bar really helps here. However, it might be useful in getting them (me?) to realise that there are actually 40 parts in the full two squares. I can see a lot of students writing 13/20 as an answer for this type of question, and I’m not sure yet exactly how I’d teach this so they didn’t. 

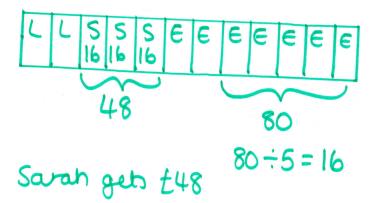
Question 13 – Ratio (3 marks)
This is another tricky ratio problem, and the second example I found where I think a bar is genuinely useful in getting a solution. I tried this with Year 10 this week after some work on solving ratio problems using bars, and they had considerably more success than I expected for quite a complex problem.

Picture

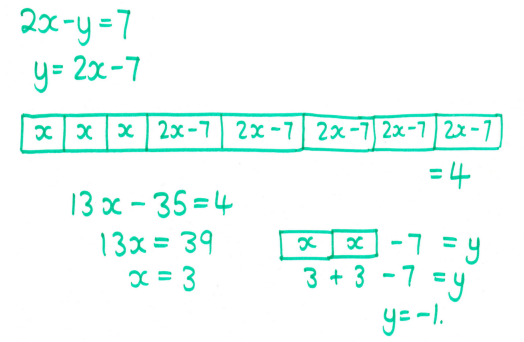
Question 17a – Simultaneous equations (3 marks)
OK, I was reaching a bit by now. This was just an experiment; I’m not sure if students would be more or less successful working this way than the traditional (elimination) method.

Picture

Conclusions (for now)
Bar modelling is:

  • Brilliant for ratio problems, even in exam situations;
  • Great for developing understanding with fractions, but less useful for actually calculating;
  • Messy for equations with any negative amounts or coefficients – if anyone can fix this in my head, please let me know!
  • Pretty fiddly for calculating percentages and proportion problems – I’m sticking with my ratio tables.

Watch this space to see if tomorrow’s session changes my mind! 

We’re going on a bar hunt Read More ยป

Teaching improper fractions and mixed numbers

Having taught this to nearly all of my KS3 groups at some point in the last few months, I think I’m becoming something of an expert. This year, we’ve started the Mastery Pathway at KS3, and nearly all of our students in Years 7, 8 and 9 (unsurprisingly) had gaps in their understanding of fractions. So I’ve now taught this about five or six times; it’s true what they say about practice making perfect (or pretty close).

Two major changes this year have been use of the bar model and linking cubes. I’m trying to do a lot more in concrete situations before moving to rules, and using manipulatives and models seems to get the ideas to stick.

1.  Start with a chocolate bar
Think Cadbury’s Dairy Milk (single bar), Kinder Bueno, Hershey Bars – anything which comes in a single row of squares or pieces of chocolate. The first thing I did was show the students some pictures of these chocolate bars, and get them to tell me each piece size as a fraction – e.g. the Bueno has four pieces, so if I eat one piece, I’ve eaten 1/4, two pieces is 2/4 and so on. We spent some time discussing what the numerator and denominator tell us about the different chocolate bars, and emphasising that the denominator told us about the size of one whole bar.

2.  Move to a physical model
I then gave students different amounts of link cubes, explaining that they were pretending these were squares of chocolate. I asked them to make me as many whole chocolate bars as they could – we used the Bueno 4 square model to start with. There were a few comments about how I’d not given them enough cubes in some cases (they were expecting multiples of four); I kept quiet and just told them to build what they could. Once they’d built for a bit, a couple of the students realised that this was the point of the task.

We then collected ideas on the board and looked at different students’ examples. I deliberately started using a bar model at this point to represent the cube pictures they were explaining. This is also a good point to get students to draw their models on the board themselves and explain what they’ve done.

3. ย Introduce improper fraction notation
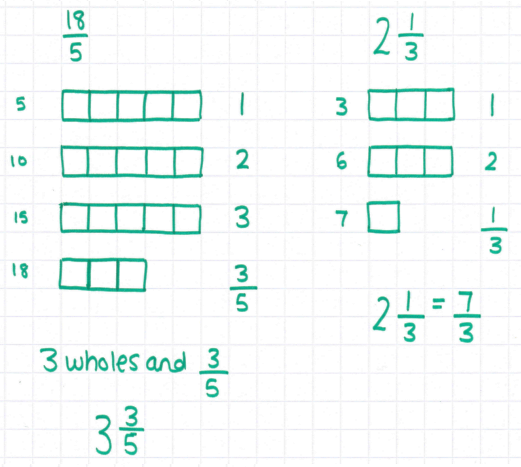
I took one example and modeled the use of fraction notation, drawing on our original chocolate examples. So 13/4 means 13 pieces of chocolate, and one whole bar has 4 pieces. We then discussed how this related to mixed number form:

  • How many whole chocolate bars? This is the big number.
  • How many pieces that don’t make a whole bar? This is the numerator of the fraction part.
  • How many pieces in a whole bar? This is the denominator.

4. ย Practise problems using cubes and diagrams
I then gave students some problems to try for themselves. They started with more examples using four-square chocolate bars, then progressed to other sizes. I kept denominators fairly small to start with (2, 3, 4 and 5), just because modelling and drawing gets a little impractical with larger denominators. I encouraged students to use the cubes where necessary, and insisted they drew diagrams for the first few they attempted.

Picture

Some students quickly spotted the “rule” and then began working without diagrams. Towards the end of the activity, we discussed what they had discovered as a shortcut method and why it worked. However, I haven’t been pushing rules too much this year – I’d rather students thought about what they were doing, and if necessary got the right answer through drawing a diagram, rather than learn a rule which is quickly forgotten.

5. ย Work the opposite way

Some of the classes I’ve tried this with were ready to move on to converting back the other way, either with diagrams or by applying understanding gained from working from improper to mixed within the same lesson.ย 

Some of them needed a little more consolidation work one way before we moved on. One lesson I’m learning this year is how important it is not to push too quickly; a new idea takes time to cement thoroughly, and I think it’s worth working on one thing properly at a time, rather than charging ahead and progressively losing students along the way.

If you’re looking for questions quickly, Math Aids has a great worksheet generator, differentiable by easy, medium and hard denominators.

Teaching improper fractions and mixed numbers Read More ยป

Which is bigger?

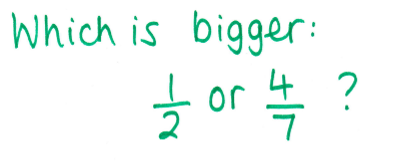
Last year, I attended the best CPD of my teaching career. It was a year-long course run by the NCETM; a project on multiplicative reasoning. Now don’t get me wrong, training days can be useful, but I can honestly say that this course changed how I teach fractions and proportion on a fundamental level. We had six days of training, spread out over the year, and had to deliver certain materials to our KS3 classes, then evaluate their performance at the end of the year to assess the effects of the project materials. I’m going to blog more about this in later posts, but in this post I wanted to focus on one of the first questions they asked us on Day 1, because it really altered my thinking about teaching fractions. It’s a simple question:

Picture

Just to give a bit of context to this, this was one of four diagnostic questions we had to give our classes prior to delivering the project materials. The students had to answer the questions in as much detail as they could, and explain their reasoning. 

We also had to try the questions. I suggest you give it a go now, too! Go on, before you peek at mine…

Is it really obvious that equivalent fractions are needed?

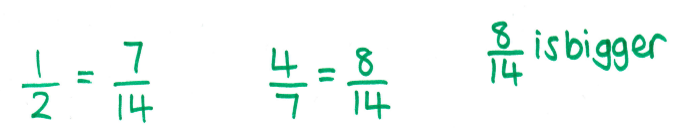
My solution looked like this:

Picture

I then put my pen down smugly, with the satisfaction that I’d got the right answer and this question was easy. Then I looked up and everyone was still scribbling. 

I realised I was looking at it from the point of view of a maths graduate and teacher; I’m comparatively “good at maths”, whatever that means. When I thought back about what I’d done, I’d automatically jumped to writing both fractions as fourteenths, because I’d “seen” the denominators 2 and 7. I knew I needed to use equivalent fractions, and that 1/2 is the same as 7/14. 

But how many of my students really understand that? Given that I’ve had GCSE students ask me what an equivalent fraction is, possibly fewer than I assume. My “explanation” relies on a deep understanding of fractions, and presupposes a lot of things. When I tried this with my KS3 classes both last year and this year, the only students who immediately jumped to equivalent fractions, like I did, were those considered “high ability”; i.e. students in higher maths sets.

I went back to my paper, and decided to think how I would explain this when teaching it, or how a student who didn’t think to use equivalent fractions might approach it.

Fractions are all about pizza, right?

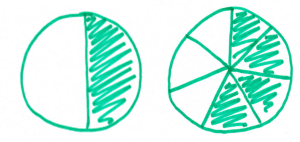
I decided to draw a picture; this is what I’d probably do to convince a student who didn’t understand my equivalent fractions explanation:

Picture

Pretty convincing? You can see from my diagram that 4/7 is slightly bigger than 1/2.

However, what you’re looking at there is attempt #5 at drawing sevenths on a circle. If you tried this problem, chances are, you drew a pizza too. And it probably took you several goes to get the sevenths looking right.

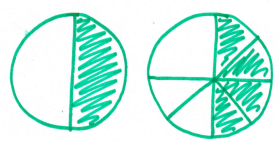
I think there were about 20 or so maths teachers there, and nearly all of us drew pizzas. When I took this away and did it with my KS3 classes, and then when I tried it again with them all this year, nearly all of them drew pizzas too. And, unsurprisingly, all of them found it at least as difficult as me to draw sevenths accurately. I’ve actually seen students draw things that cause conceptual misunderstandings, like this one:

Picture

When I do this task with a class now, I ask students to come to the board and draw their diagrams. They always find it difficult to draw the second one correctly, even if they’ve got it fairly accurate in their book.

Pizzas are pervasive in teaching fractions. I guess I can see why; most students will have seen pizzas cut up into pieces, but think about the size of those pieces. Order a takeaway pizza and it’s usually sliced into eighths, with options for sixths or tenths occasionally, but never something difficult to cut, like ninths or sevenths. When I cook a pizza, I half, half and half again because that’s the easiest way to get equal slices. I tried cutting a pizza into sevenths once, just for kicks. Unsurprisingly, I got something that looked like the picture above (and a very messy tea).

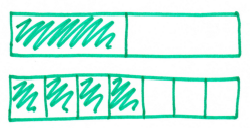
Maybe the pizza model is useful, but it’s not the only thing we cut up and share out. I realised that I always supplied students with the example of pizza (or occasionally, a birthday cake), but never thought about using non-circular pictures, like a chocolate bar.

Why not use a rectangular model?

After a bit of discussion along the lines above, we were asked to have a go at drawing a rectangular diagram:

Picture

First of all, I found this much easier to do. Splitting into sevenths still isn’t really straightforward, but this was attempt #2, rather than #5. I don’t know if it’s something about the linear representation, but I could just tell that these pieces were more equally drawn than on my circles. I’ve seen students draw seven pieces, one by one, then draw the other diagram the same size and split in half by eye (much easier to do).

Secondly, there’s a direct comparison – you really can see that 4/7 is bigger than 1/2, and even begin to see by how much. It’s not a full seventh bigger, it looks more like half a seventh (and believe me, if you try this with a group of students and they go down that route, the discussion that comes out of that is invaluable).

This idea of rectangular modelling comes from Singapore. Over the last 18 months or so, I’ve seen and heard the words “Singapore bar model” more and more frequently in blogs and lesson plans. It seems to be the latest “trendy” idea in maths teaching, but don’t dismiss it just because of that – it’s actually really useful in loads of areas of maths.

Taking it further

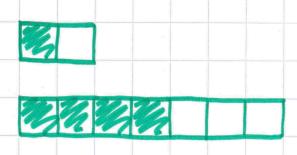
We did all of our work for this first part on plain paper, and it’s worth getting students to do this too initially, just to see what they can manage to do by estimating. However, when I’ve used this task as a precursor to a unit of work on fractions this year, we’ve done this, then moved to their books, which have squared paper in them – and this is where the bar model really gets interesting.

I ask students to draw the diagrams in their books, and think carefully about how they can use the squares to help them. Inevitably I get a couple of these:

Picture

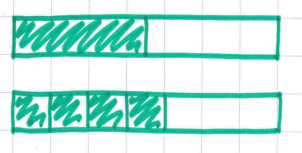
This leads to a great discussion about what the whole amount is. Coming back to a chocolate bar analogy here is useful; are the two bars drawn there the same size? Once that discussion has happened, then most go to this:

Picture

We then talk about how they have chosen the length of their bar, and why there are 3 and 1/2 squares shaded on the top diagram. Some students then refine their earlier explanations about why 4/7 must be bigger, along the lines of “with 1/2 you only get 3 and 1/2 pieces but with 4/7 you get 4 pieces”. It’s also a nice opportunity to discuss whether it’s OK to have decimals as numerators of fractions.

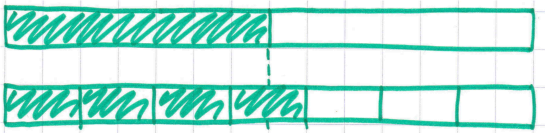
Depending on the class, it then goes one of two ways. I sometimes find that one or more students has naturally drawn something like this:

Picture

This leads to a really interesting discussion about why the length 14 has been chosen, and links really nicely into equivalent fractions.

If no-one has done this, then I challenge students to redraw their original diagrams using a different length of bar, but that they must avoid having half-squares on their new diagrams, ultimately leading to the same result – lots of bars of length 14, with a discussion about why. I occasionally get a bar of length 28, which makes the discussion even more interesting.

I don’t tend to push towards equivalent fractions straight away. Some may spot that 1/2 is the same as 7 pieces out of 14, but I give them a bit more practice with some other examples first.You can download some example questions here, or have a go at making your own up – I promise it’s a lesson worth trying!

Which is bigger? Read More ยป