ratio tables

Introducing speed with ratio tables
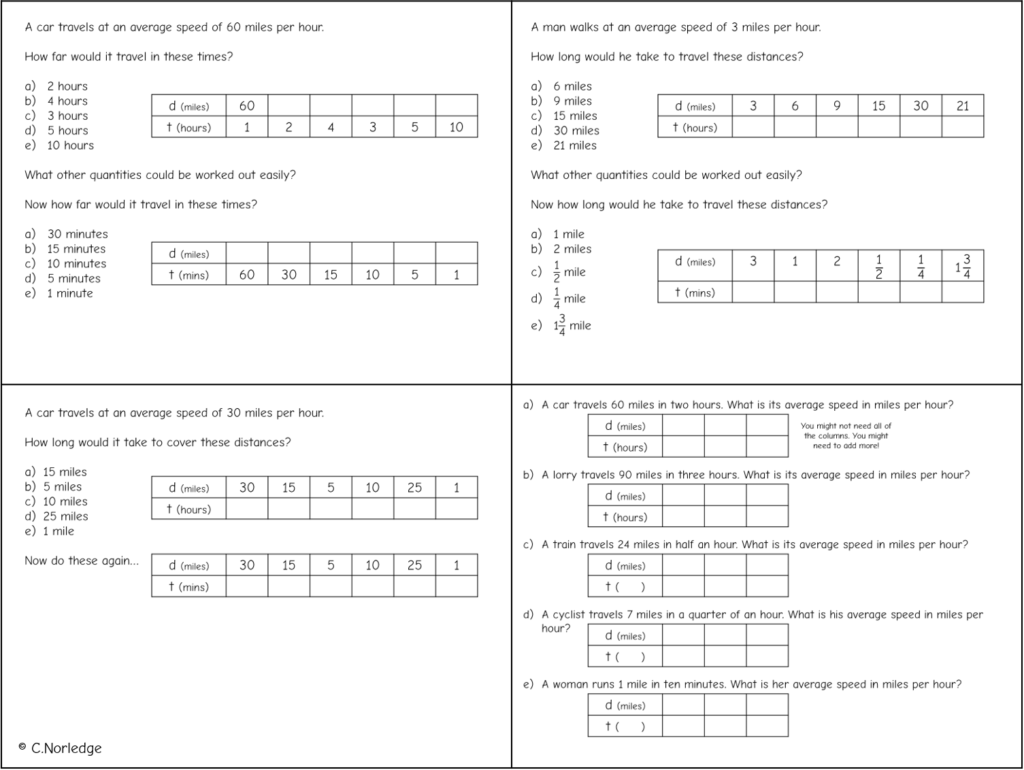
These activities were inspired by Adam Boxer’s episode of Mr Barton Maths Podcast – specifically the section in which Adam mentioned teaching speed, distance and time by working with time calculations first. Unfortunately I didn’t record the timestamp, but if anyone fancies listening to the whole thing and letting me know, that would be cool…

Anyway, as I listened I was thinking about ratio tables and how those calculations would look – so here are a few possible activities.

1. What is speed?

Speed is a compound measure, which means it has two (or more) different units. The other biggies at GCSE are density and pressure, and I’m going to be looking at a similar approach to both of these over the next few days.

The idea with this first activity is to emphasise the idea that speed is the distance travelled in a given unit of time (usually minutes or hours). So the first section looks at multiplying up to find whole hour amounts, and the second section emphasises that if you go 60 miles in 60 minutes, you go 30 miles in 30 minutes (and so on).

Whether or not I’d always give learners the first column in the ratio table is up for debate and probably dependent on the group/situation. Entering the information into the first column is the most difficult thing about using ratio tables I reckon! But it’s good to have the discussion about “60 miles per hour means 60 miles in 1 hour” as you enter the “1” into the time row.
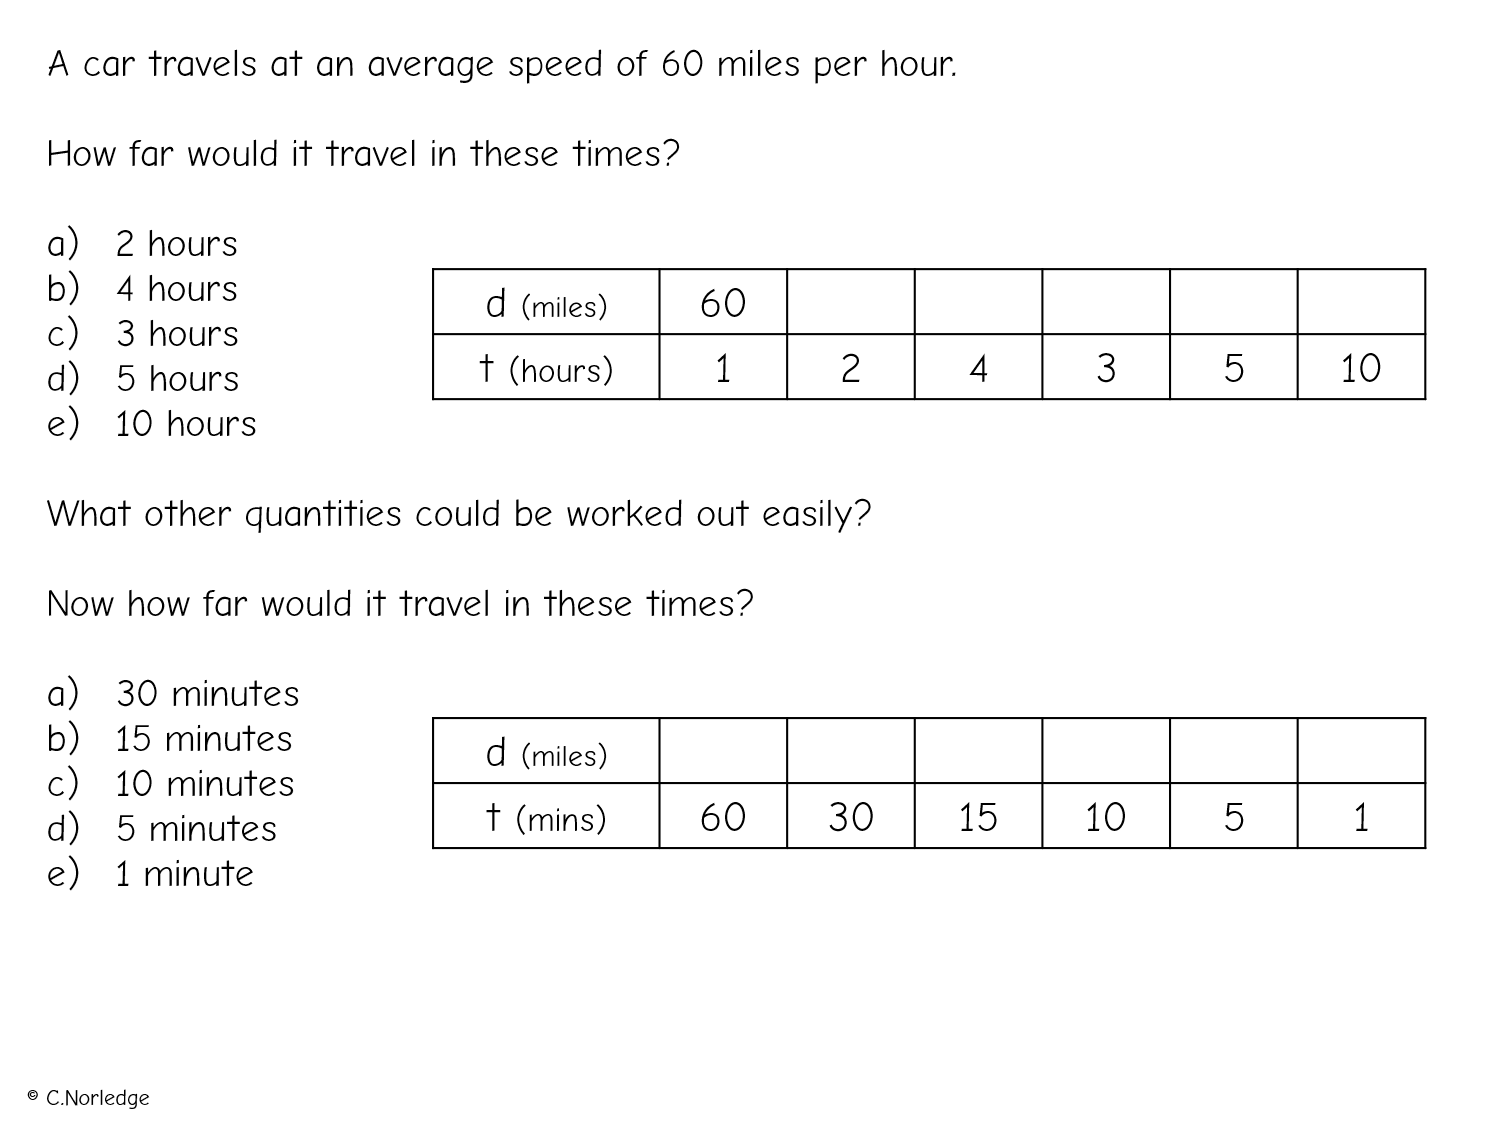
2. Finding times

So now, flipping it round and working out the time taken to travel given distances. The first section is just multiplying up and combining other amounts (so 21 miles from 30 – 9 or similar).

The second section looks at what happens when you start to look at amounts less than one hour. Depending on the group you could tell them to use minutes straight away (as in the ratio table) or just give them a blank space and see if they figure it out for themselves.
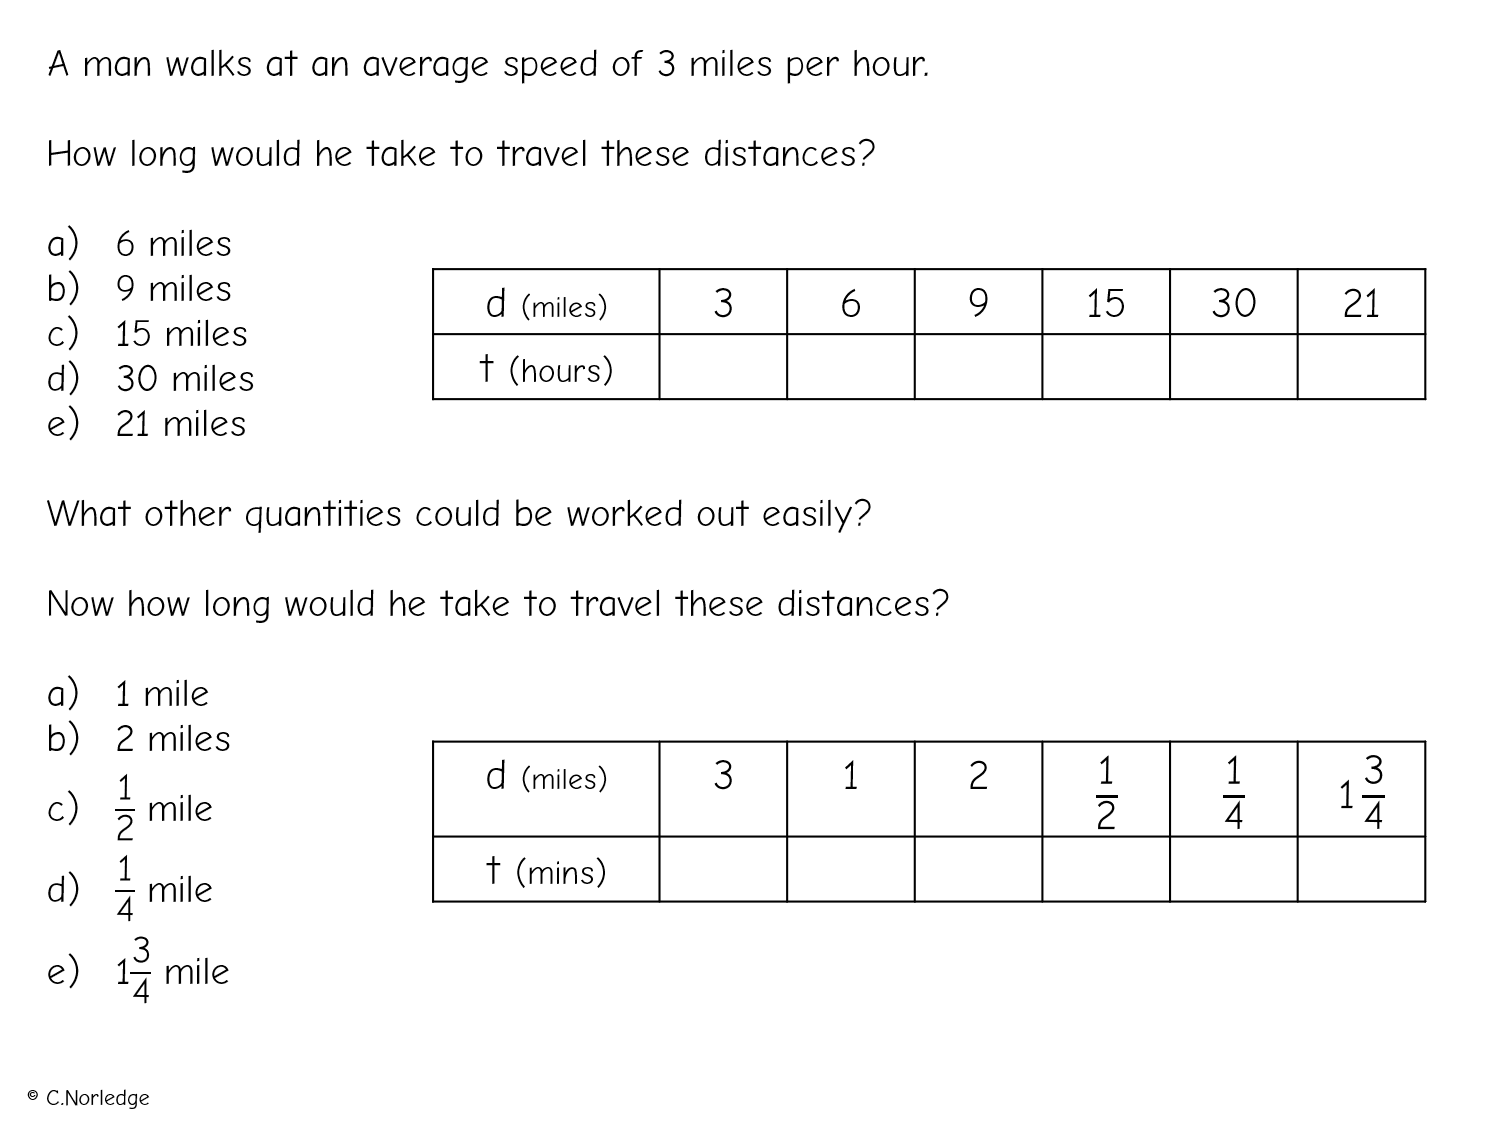
3. Hours or minutes?

This is a task specifically designed to show learners that it’s sometimes easier to work the calculation in minutes (and convert to the desired units at the end) than work with fractions of an hour. Of course, some learners might be perfectly happy with 25 miles taking 5/6 of an hour, but I think minutes makes more sense in my head for questions like this one!
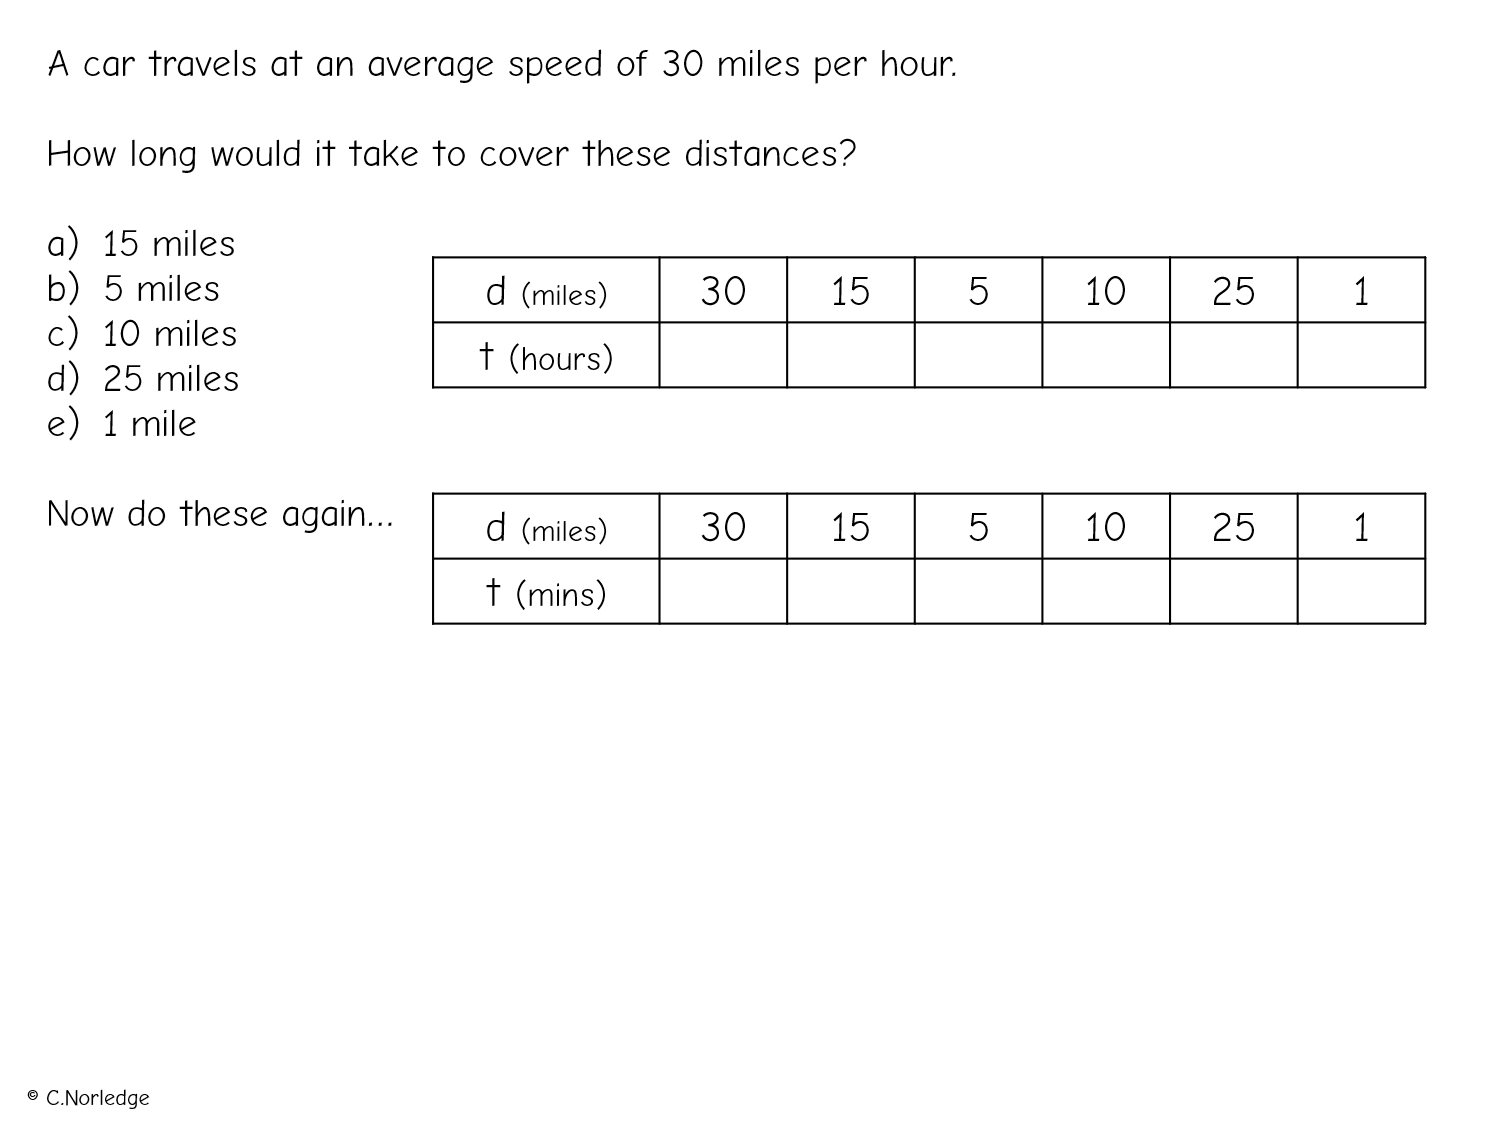
4. Finding speeds

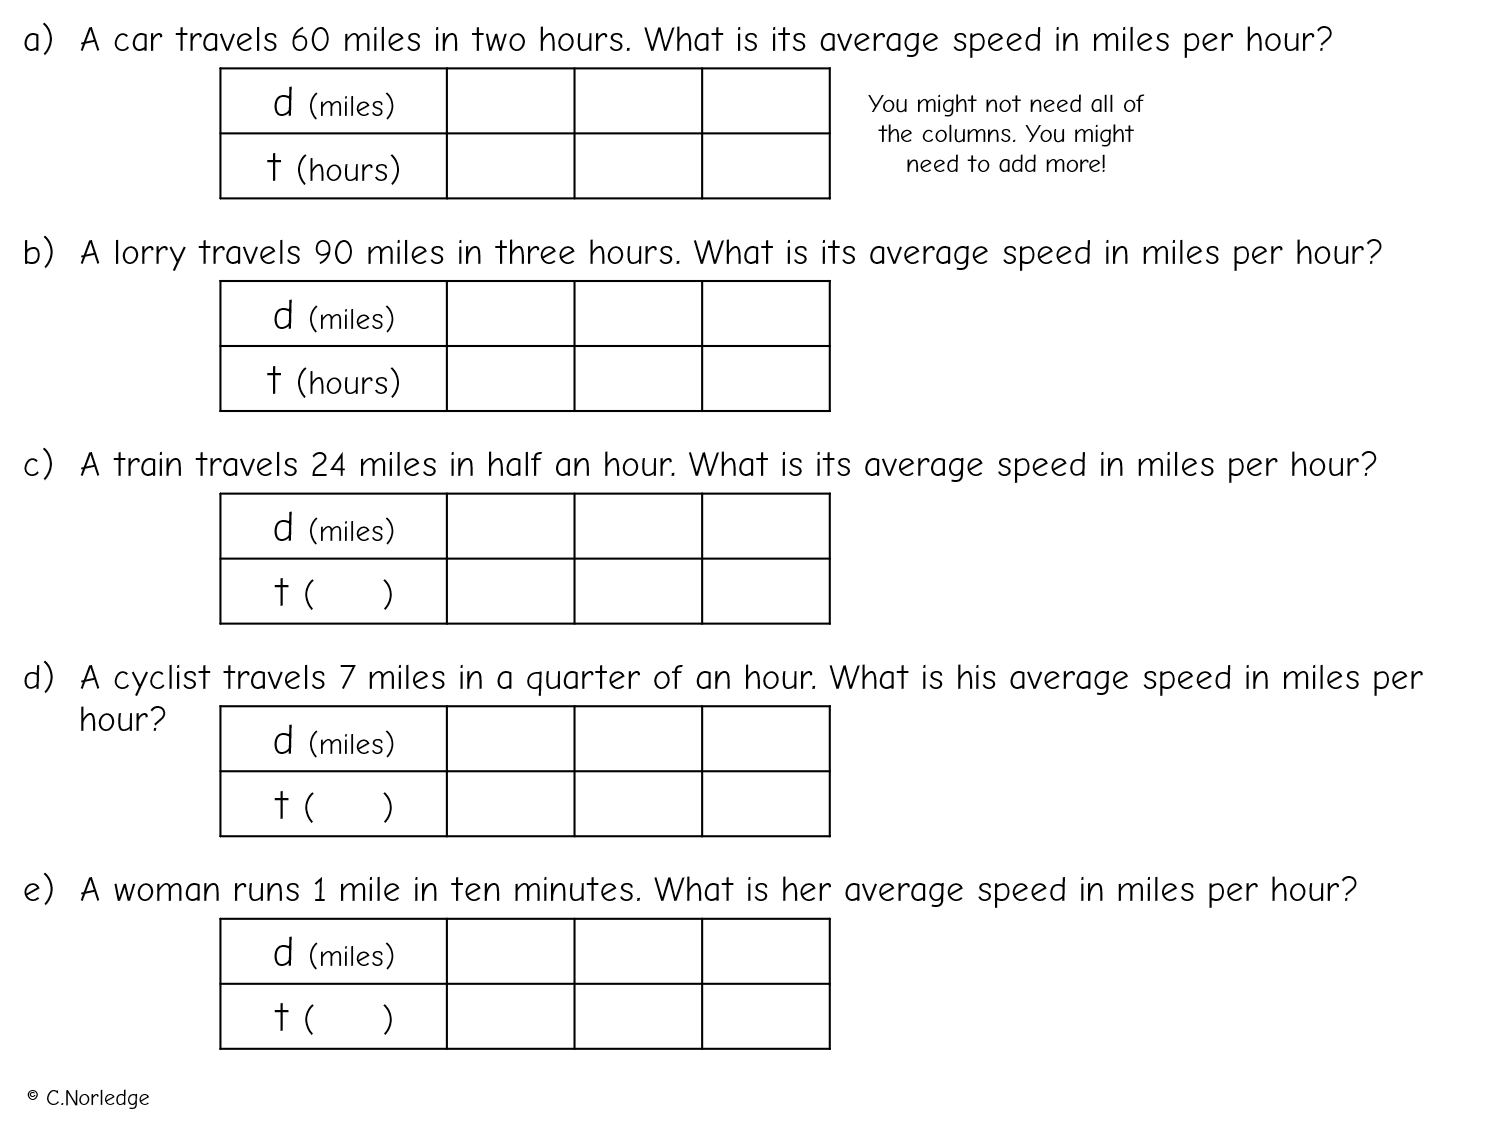
Finally an activity about calculating speed – some multiplying up, some dividing. The time units are blank in c-e as it’s worth having a discussion here about whether to work in hours or minutes.
Introducing speed with ratio tables Read More ยป

Proportional reasoning on Edexcel June 2015 P1

I’ve written quite a few posts recently aboutย using ratio tables extensivelyย in my teaching for proportional reasoning. Following the explosion on Twitter about Edexcel’s non-calculator paper last Thursday, I thought it might be time for a critical evaluation on my part of just how useful (or not!) they are in tackling any or all of the proportional reasoning problems on the most recent paper, particularly if we should see this as an indicator of things to come, as @El_Timbre suggested in thisย brilliant blog postย on Sunday.ย 

I’m approaching this from the point of view of pupils aiming for a grade C, as I’ve had borderline groups for the last two years, and no top GCSE sets for about four, due to having plenty of A Level Maths on my timetable already, so I’ll admit that my pedagogy and knowledge of grade A/A* topics at GCSE is fairly limited.

Q1b Percentages from a stem and leaf diagram

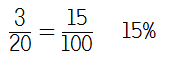
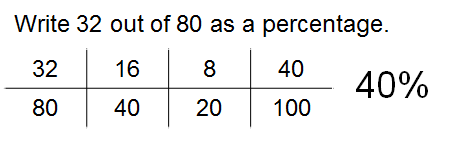
I posted about how useful Year 11 found ratio tables for converting fractions to percentagesย back in May, and I was happy that at least three pupils mentioned to me after their exam that they’d used this strategy on this question to get the correct answer.

I’m still pretty convinced on dealing with fraction to percentage conversions with ratio tables, but I can see that it might be a little unnecessary here. I’d like to think that once pupils had got the fraction 3/20, they would spot that 20 goes into 100 five times and multiply the numerator accordingly.

Q4 Plant comparisons

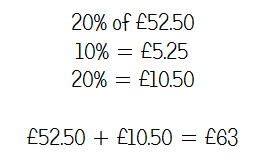
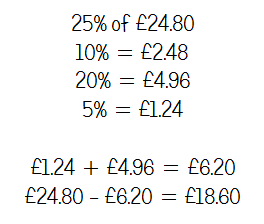
Overall, I thought this was a nice little problem-solving question. It involves pupils working out a percentage, then deducting this from the total cost. Again, I know that most of my groups have found ratio tables useful for structuring their working out, but 20% is a fairly simple percentage, so I can see some pupils not bothering.

Q9 John’s conference

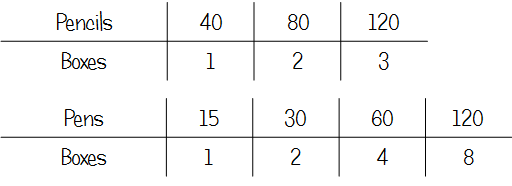
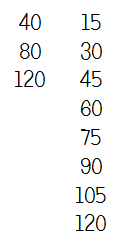
As the Twitterverse astutely observed, why not get people to bring their own pencils? However, assuming John doesn’t want to put people out, this was a fairly straightforward LCM problem. I quite like the ratio table approach here as it tidies up listing the numbers somewhat, and might avoid any silly errors with miscounting the number of boxes at the end. It also allows pupils to double up to 8 boxes of pens without having to write down each number up to 8 x 15, again eliminating potential for slips in calculations.

Q10 Mary’s conservatory

I’ve been trying to encourage my Year 11s to scrape every single mark on the Higher paper, and split problem-solving questions where possible. Many of these area/problem solving questions include a percentage calculation that can be done without needing to find the area first. 

In a similar vein to the plant comparison question, the only benefit of a ratio table here is structuring working out – I don’t think it adds anything in terms of making the calculation more straightforward.

Q11 Karl’s game

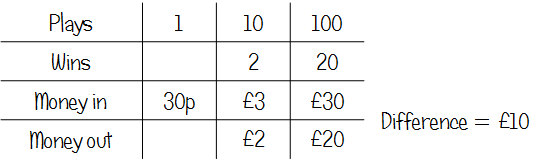
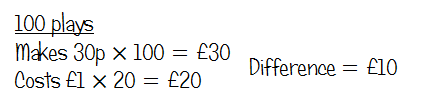
Again, a table offers a bit of help in terms of structuring working out here. If pupils get used to constructing these for themselves, it’s conceivable that they’d find this useful to put in what they know, then work out anything else that they can. It might help them to make the link between 10 plays in part (a) and 100 plays in part (b).

Q14 Raksha’s journey

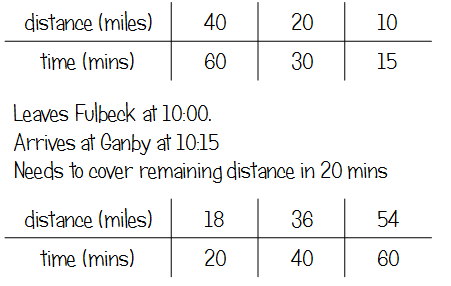
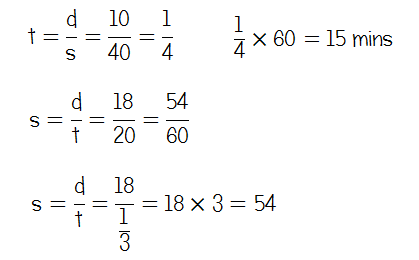
This is the first question I met that really convinced me that a ratio table was the superior method or way to structure working. From conversations with pupils (and reading on Twitter), I know that those who applied the sdt formula got really confused with units – there needs to be an appreciation that the time is given in minutes but speed given in miles per hour. Structuring using a table kind of avoids these errors in the first part of the calculation, and makes it clearer to see what you need to do in the second part to get an answer in miles per hour.ย 

Q15b Does the point lie on the line?

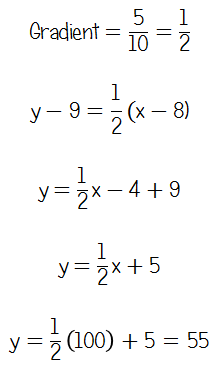
This question pulled me up short a bit – I’ve avoided this with my Year 11s this year in favour of cherry-picking easier marks – but when I was doing the paper, I immediately used the “A Level” formula y – y1 = m(x – x1). I went back and checked over the current and new GCSE syllabi, and finding the equation of a line given two points seems to be listed as new spec only, but, as I said at the top, I have limited experience with teaching A/A* topics and related pedagogy.

According to this site, it’s a new topic coming to Foundation and Higher, so there are obvious implications for teaching next year.

Chatting to a few pupils in top sets, many of them either found the gradient, then substituted in one point to find the y-intercept, or, overwhelmingly, used a sketch.

A colleague suggested that the approach she had used was getting them to work out the gradient from the two points, then work out if the third point gave the same gradient.

However, I started to think about making this question accessible for borderline pupils who (let’s face it) won’t have as developed algebra skills as those aiming for As or A*s.

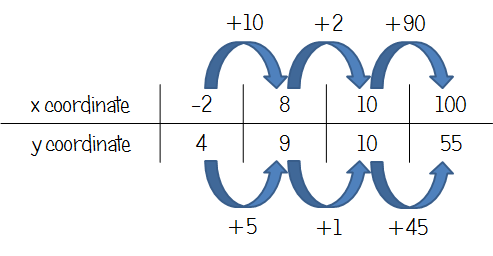
Now, obviously this isn’t really a “ratio” table, as we’ve got a linear relationship, not direct proportion. However, if we look at the change in x and change in y for the two points we’ve been given, it’s clear that the increase in x is double the increase in y. 

From here, it’s not too difficult to get from 8 to 10 and then 10 to 100 with the x coordinates, resulting in a y coordinate of 55, proving that the point (100, 56) is not on the line.

Whether or not this is an acceptable way to “show how you work out your answer” remains to be seen!

I’m not meaning this to be a passionate argument for the use of ratio tables – they work really well with some pupils for basic percentage calculations, and (I think) have stopped some of mine from just panicking in an exam and working out “something”, then going from there. I think use for SDT and DMV may prove really useful, particularly for those that struggle to rearrange formulae.

What do you think? Drop me a comment below!

Proportional reasoning on Edexcel June 2015 P1 Read More ยป

Fraction and percentage equivalence using ratio tables

It seems that two years of shameless use of ratio tables have finally paid off; I saw three of my Year 11s independently tackle a non calculator percentages question like this today:

Picture

I’m not sure exactly how I would have taught this before I discovered ratio tables; I suppose just pray that they noticed a common factor of 8 in the numerator and denominator to get them to 4/10, then realise that they need to multiply numerator and denominator by 10 to get 40/100. 

I’ve previously blogged about how useful I’ve found ratio tables for percentages of amounts, increases and decreases. but I’ll also be adding this permanently to my repertoire for fraction and percentage equivalence from now on. It’s incredibly helpful for those pupils who just refuse to look for factors other than 2!

If you fancy giving it a go, you may be interested inย this worksheet:

Fraction and percentage equivalence using ratio tables Read More ยป

From bar modelling to ratio tables – tidying up percentages

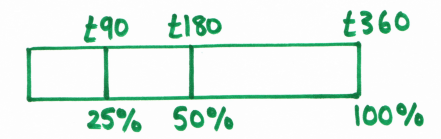
It’s no secret that I’m a big fan of bar modelling to get pupils to really think about the calculations they are doing. It’s a great way to introduce work with percentages too, and solidifies the link between percentage and fraction calculations. One particular advantage is the flexibility it affords – I had one pupil decide that the best way for her to find 15% was to work out 25% and 10%, then subtract one from the other, rather than the more “traditional” method we’d probably all teach of finding 10% and 5%, then adding together.Here’s 25% and 50% of ยฃ360 on a bar – easily found by halving and halving again.

Picture

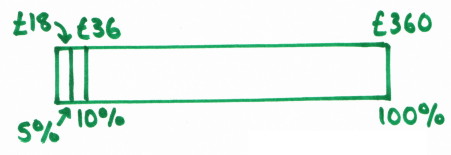
However, although I use bar modelling when introducing new concepts with percentages, once pupils have drawn enough bars to get the ideas, I then push them on to using ratio tables for calculations instead. The bar’s great for larger percentages, but once you get down to the useful building blocks like 10% and 5%, the left hand side of the bar starts looking very messy indeed. And you can forget trying to show 1% on a bar with a suitable scale for exercise books. Here’s 5% of ยฃ360 on a bar:

Picture

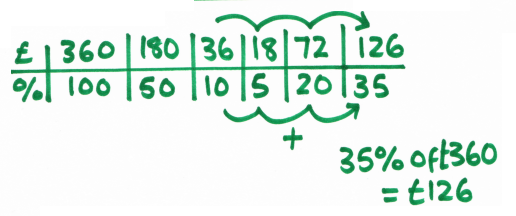
Now here’s a ratio table using ยฃ360 (I decided to find 35% in this example):

Picture

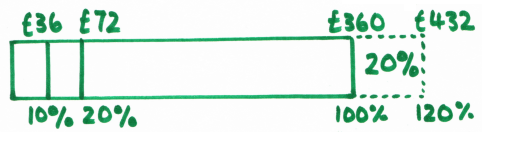
I love using these as the flexibility of the bar is preserved; pupils can still approach problems from different angles and, if they can’t see a clear route through a problem, they can at least work out some amounts to see if that helps. You can see that, although I’ve chosen to find 10%, 20% and 5% then add together, it would equally be fine to work out 30% from 3 x 10%, then add to 5%, or even work out 15% and subtract this from 50%, and some great classroom discussions come out of the different approaches pupils have used.Here’s a bar for ยฃ360 increased by 20%:

Picture

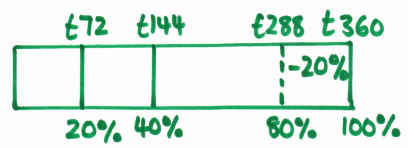
Bars are brilliant for encouraging pupils to think about the idea that increasing an amount by 20% is the same as finding 120% of something, which is useful for further work on percentage multipliers.And here’s a bar for ยฃ360 decreased by 20%:

Picture

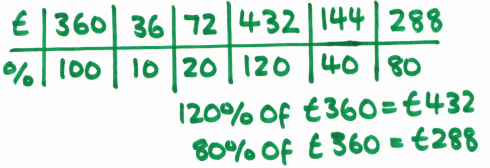
Again, you can see the link between a 20% decrease and finding 80% of that amount.It’s worth being very careful about how quickly you move away from bar modelling with percentage change problems; pupils need to be really confident with what 100% means in the context of the problem. However, once they’re fine with that, here’s a ratio table for ยฃ360, with both a 20% increase and 20% decrease shown:

Picture

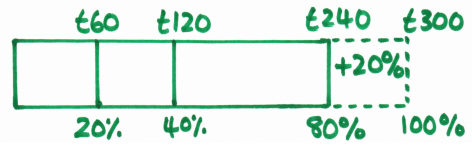
The next logical step is reverse percentages – finding the original price if you know the increased or reduced price. Here’s a bar for an item costing ยฃ240 with a deduction of 20%:

Picture

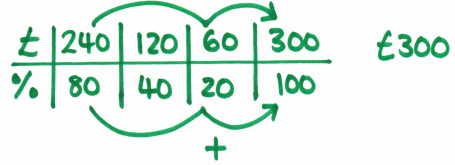
Because there’s so much scope for confusion with these, I’d spend a lot more time using bars with pupils until I’m satisfied they can satisfactorily distinguish between these and standard increases or decreases. The bar has a distinct advantage here that it’s more difficult to make the mistake of dividing ยฃ240 by 10 to get 10%, because it’s more intuitive to work down in halves.

Here’s the ratio table:

Picture

Because ratio tables are quick and easy to draw, I encourage them in exam situations for non-calculator problems, particularly for those pupils who get lost in their working out and tend to just scribble their calculations all over the page.

Ratio tables are also fantastic for other problems, such as all the proportion stuff like currency conversion. There’s also a direct link to proportion graphs, as you’ve got your table of values to create the graph straight away.

From bar modelling to ratio tables – tidying up percentages Read More ยป