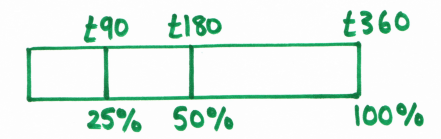
It’s no secret that I’m a big fan of bar modelling to get pupils to really think about the calculations they are doing. It’s a great way to introduce work with percentages too, and solidifies the link between percentage and fraction calculations. One particular advantage is the flexibility it affords – I had one pupil decide that the best way for her to find 15% was to work out 25% and 10%, then subtract one from the other, rather than the more “traditional” method we’d probably all teach of finding 10% and 5%, then adding together.Here’s 25% and 50% of £360 on a bar – easily found by halving and halving again.
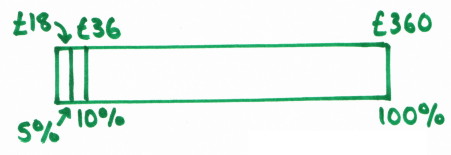
However, although I use bar modelling when introducing new concepts with percentages, once pupils have drawn enough bars to get the ideas, I then push them on to using ratio tables for calculations instead. The bar’s great for larger percentages, but once you get down to the useful building blocks like 10% and 5%, the left hand side of the bar starts looking very messy indeed. And you can forget trying to show 1% on a bar with a suitable scale for exercise books. Here’s 5% of £360 on a bar:
Now here’s a ratio table using £360 (I decided to find 35% in this example):
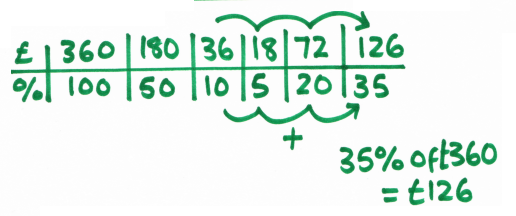
I love using these as the flexibility of the bar is preserved; pupils can still approach problems from different angles and, if they can’t see a clear route through a problem, they can at least work out some amounts to see if that helps. You can see that, although I’ve chosen to find 10%, 20% and 5% then add together, it would equally be fine to work out 30% from 3 x 10%, then add to 5%, or even work out 15% and subtract this from 50%, and some great classroom discussions come out of the different approaches pupils have used.Here’s a bar for £360 increased by 20%:
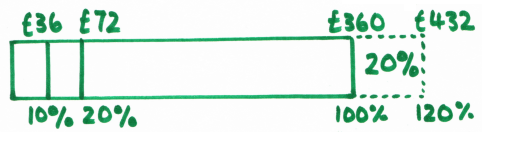
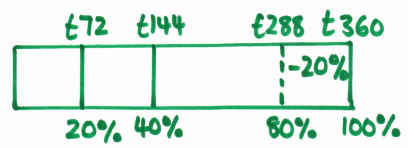
Bars are brilliant for encouraging pupils to think about the idea that increasing an amount by 20% is the same as finding 120% of something, which is useful for further work on percentage multipliers.And here’s a bar for £360 decreased by 20%:
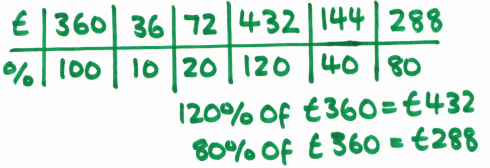
Again, you can see the link between a 20% decrease and finding 80% of that amount.It’s worth being very careful about how quickly you move away from bar modelling with percentage change problems; pupils need to be really confident with what 100% means in the context of the problem. However, once they’re fine with that, here’s a ratio table for £360, with both a 20% increase and 20% decrease shown:
The next logical step is reverse percentages – finding the original price if you know the increased or reduced price. Here’s a bar for an item costing £240 with a deduction of 20%:
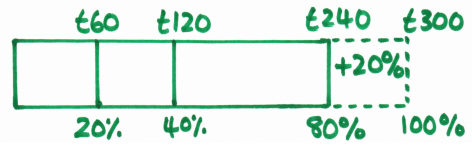
Because there’s so much scope for confusion with these, I’d spend a lot more time using bars with pupils until I’m satisfied they can satisfactorily distinguish between these and standard increases or decreases. The bar has a distinct advantage here that it’s more difficult to make the mistake of dividing £240 by 10 to get 10%, because it’s more intuitive to work down in halves.
Here’s the ratio table:
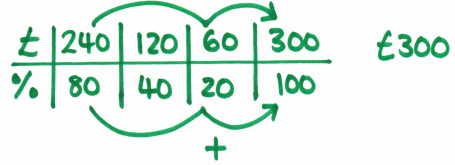
Because ratio tables are quick and easy to draw, I encourage them in exam situations for non-calculator problems, particularly for those pupils who get lost in their working out and tend to just scribble their calculations all over the page.
Ratio tables are also fantastic for other problems, such as all the proportion stuff like currency conversion. There’s also a direct link to proportion graphs, as you’ve got your table of values to create the graph straight away.