I’ve been using bar modelling quite extensively in my teaching since being involved with the NCETM’s multiplicative reasoning project last year. Part of the project was to emphasise the importance of diagrammatic representations of problems in teaching maths for understanding; we were given materials to deliver to Key Stage 3 classes, some of which included use of Singapore bar modelling for topics such as fractions, percentages and ratio. I found the work we did really altered my teaching; I think that I managed to teach addition of fractions successfully for the first time since I started teaching, and I was amazed at just how well my students retained efficiency and accuracy with “traditional” written methods.
It seemed like a bit of a no-brainer to pick the bar modelling workshop at the Celebration of Maths, so I and my colleagues trotted along to the session, sat down with our mini-whiteboards and got ready to draw some bars. One thing I was really keen to get out of this session was to iron out some issues I still had with using the bar to solve problems with negative amounts, and I was still struggling to see how to apply bar modelling to exam technique (see my attempt with the Edexcel SAMs here).
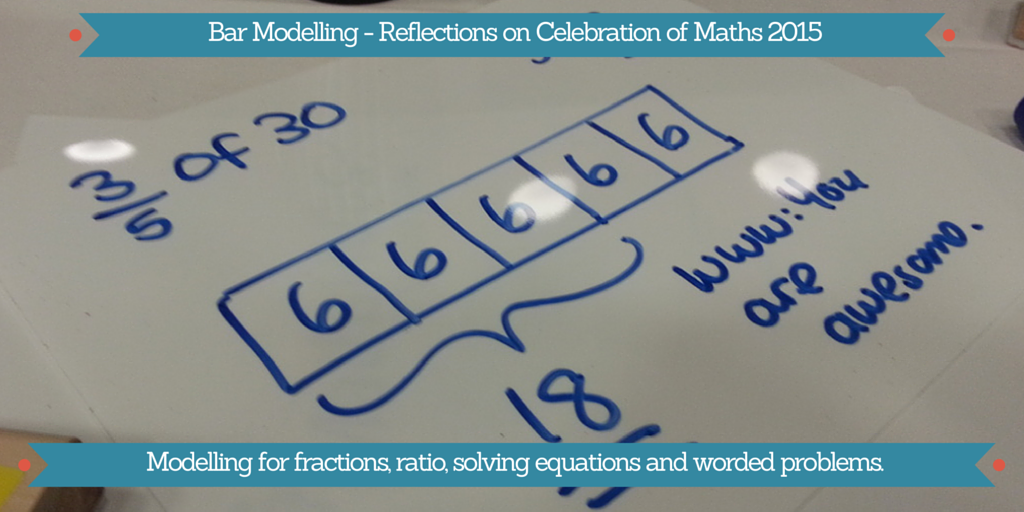
First of all we looked at some simple problems, like fractions of amounts. I’m already pretty happy with this – there are plenty of examples of stuff like this in my Year 7’s books at the moment. I was so proud of myself that I thought I’d add a really constructive “what went well” to my work too.Using a bar model to find 3/5 of 30.However, something I’d not thought of consciously is the importance of getting students to also write down the calculations they are doing. You can see in the picture I’ve written down that I did 30 ÷ 5 to get 6 for 1/5 of the whole amount, but I rarely get students to do this at the moment. I’ve noticed that some students naturally move away from drawing a bar once they have done a few problems and can “see” what’s going on, but I’m going to enforce writing of calculations too from now on, in the hope that more of them will be able to make this step.
Something else that I realised was that I’d been thinking about bar modelling all wrong; it’s a tool for developing understanding, not just “another method”, and I’m aware that, in some cases, I’ve been treating bar modelling as a method (again, see my struggle with the SAMs). This session really clarified in my mind that the bar isn’t a replacement for traditional methods in terms of efficiency, and I really shouldn’t hold back students who already understand by insisting they use bars all the time; it’s more of a stepping stone to get them to understand and think critically about the calculations they are doing, so they can move from concrete/pictoral representations to being able to solve the problems using “just numbers”.
Next up, we looked at equations. I developed and trialled a load of algebra tiles resources of the back of the NCETM project last year, which have been quite successful. I’ve not taught solving equations from scratch yet this year, but I’m planning on marrying up the work with algebra tiles and bar modelling. Rather than actually do the problems in the presentation, we decided to have a heated discussion about how to deal with negatives in equations instead (yes, like those annoying kids who don’t pay attention to what’s actually going on!).
Here are our thoughts and diagrams for 2a – 1 = 5. We really struggled to get our heads around how to represent a negative amount or subtraction on the bar!
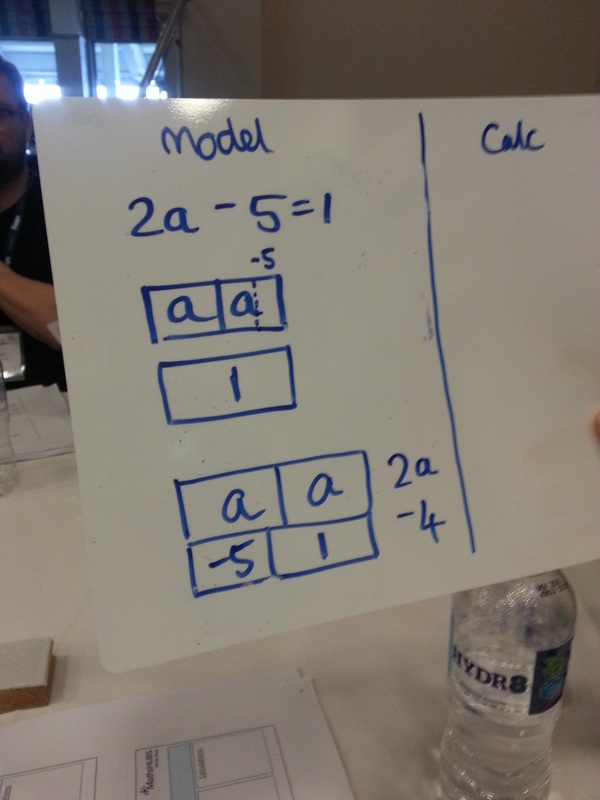
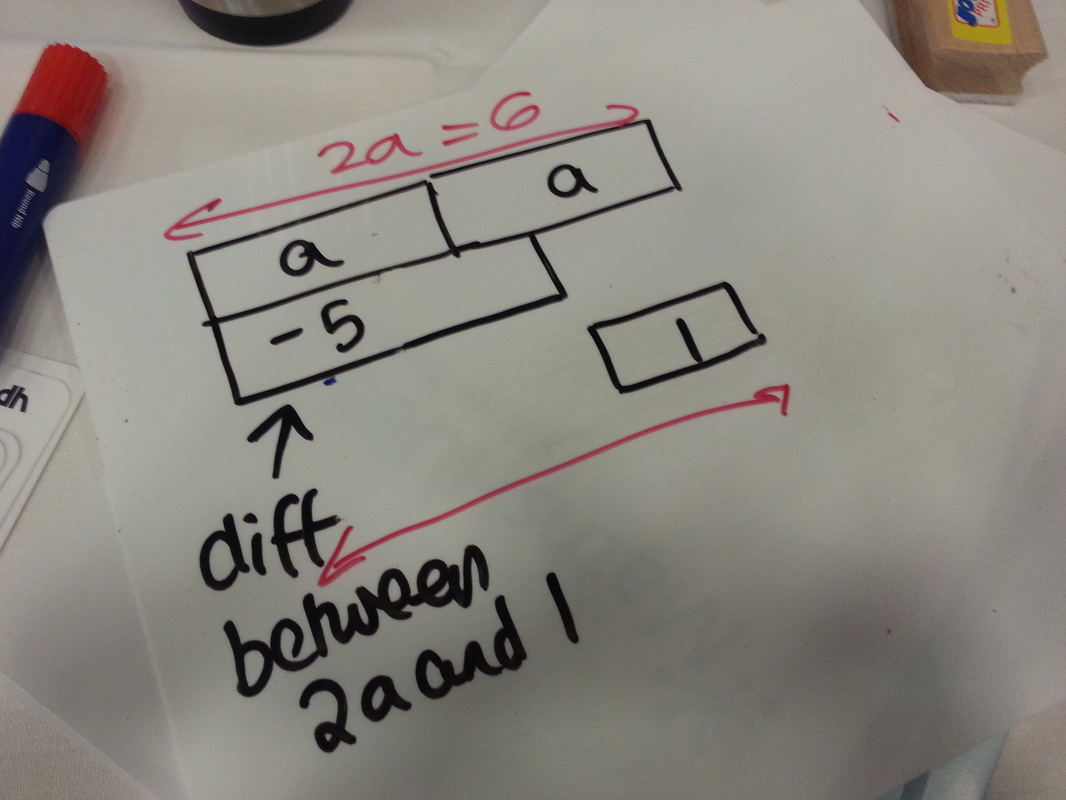
We finally cracked it (kinda) with the second and third diagrams. If you think about the equation as “the difference between 2a and 5 is 1”, then you can show this using blocks. I’m still not sure whether or not I actually want to put a negative sign with that 5. You can then see that 2a = 6 and deduce that a = 3.
This took quite a while, and caused a lot of hurty heads! We concluded that bar modelling was really useful when introducing solving equations, if done with positive numbers and solutions, but that working with negative amounts or subtractions is much simpler with algebraic representations.
We then had a look at some ratio problems. I commonly use one big bar to represent the whole amount, marking on the people with letters or similar, and then showing one share (top diagram). However, in the workshop we did this by drawing three separate bars, one underneath the other (bottom diagram).
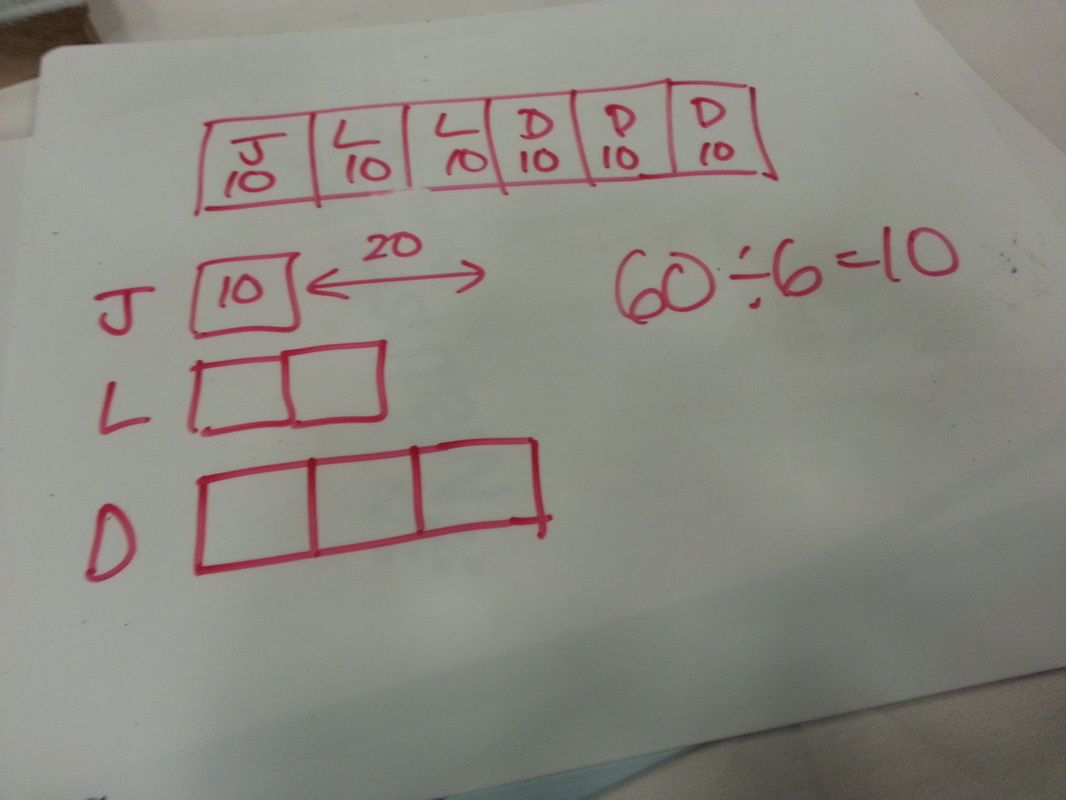
I think both representations have their merits. Using one big bar links more easily into fraction/ratio equivalence and finding fractions of amounts. I’ve certainly had a lot of success in getting students to understand and do ratio problems using this. However, in problems where the difference between two people’s shares is important, I can see how separate bars make it easier to compare or find differences.
The problem for this diagram was something along the lines of:
There are 300 students in two groups, A and B. A has 50 more students than B. How many in each group?
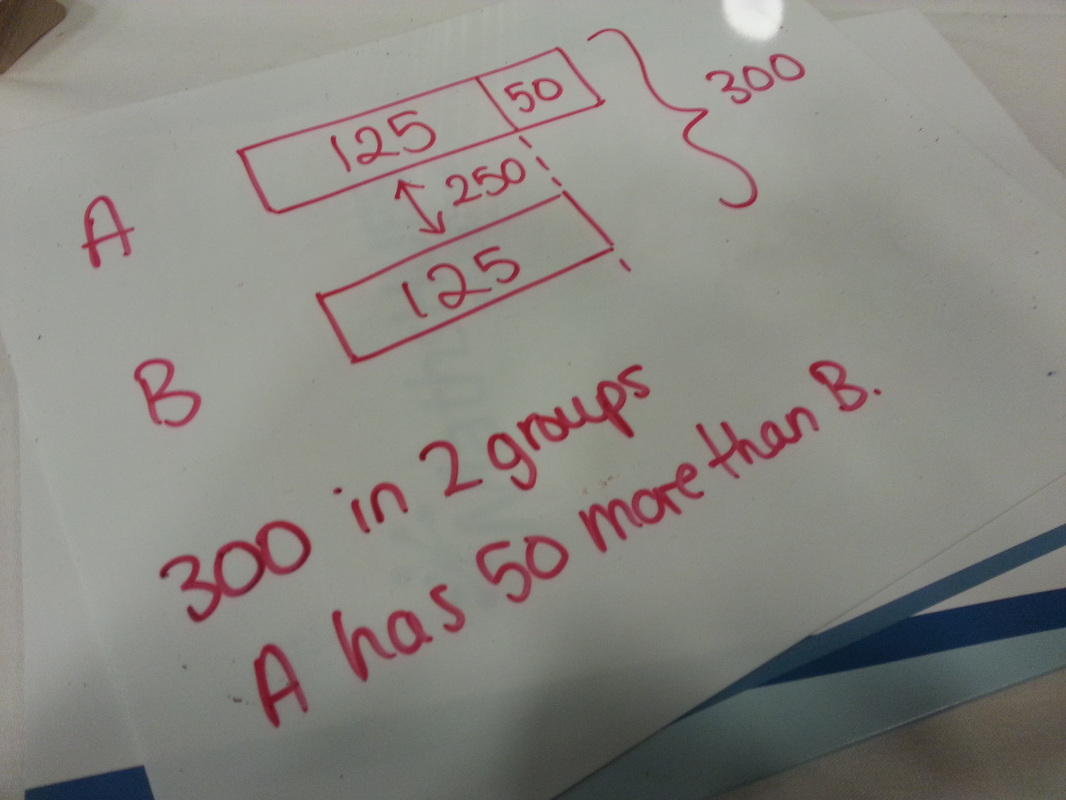
This was a great example of when a bar model would probably be one of the most efficient ways to solve this quickly.
The biggest thing I got out of this workshop was that the bar model is not just another method to get students to pass exams. For most exam questions, it’s probably fairly inefficient, although I’d like to hope that with enough work on bar modelling, it might mean that students can try to tackle problems even if they are unsure of exactly what the question is asking. However, it really should be embedded in our maths curriculum as a powerful tool for developing understanding and as a stepping stone from concrete to abstract.
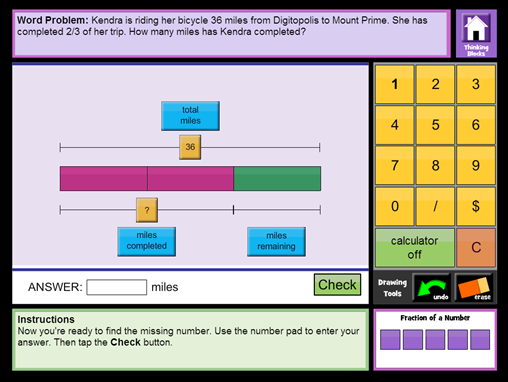
One last thing mentioned was Math Playground; I’ve had a quick look and they have some great tools for creating and solving bar model problems. Here’s one I made earlier: