Excuse the pun, I’m just quite excited about the Celebration of Maths event tomorrow. Due to the fact that I’m going to the bar modelling session tomorrow (and that I’m a geek who loves doing Maths on a Friday night), I decided to go on a bar modelling hunt using the Foundation paper 1 from the Edexcel GCSE 9-1 Sample Assessment materials.
As a side note, this is the first time I’ve sat down and properly worked through any of the new SAMs… and man, they are hard! It will be interesting to see what comes out of the Ofqual stuff in the next few months. But regardless, I’ve gone through and picked out all the questions that (I think) could be done using bar modelling. The last hour has made me re-evaluate my ideas about bar modelling as the absolute best thing that’s happening in maths teaching – don’t get me wrong, I’m loving it for developing understanding while teaching new concepts, particularly for fractions and ratio, but I’m more convinced that there’s still a place for “standard methods” than I was six months ago.
Anyway, here are some mathematical scribblings and ramblings. Due to copyrighting etc, I’m not reproducing any of the original materials on here, so you might want to open a copy of the paper too.
Question 1d ~ Percentage of amount (2 marks)
Nice, straightforward percentage question – find 15% of 120. Here’s my bar model:
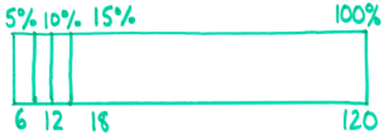
I decided a while ago that I dislike using a bar model for percentages. It’s great when introducing percentages and getting students to think about what 10% really looks like, but is pretty impractical for actually solving most percentage problems. Just look at that mess bunched up at the bottom of the bar! I suppose I could have drawn my bar a little bigger, but there’s finite room on a page.
I’d probably tackle this question with students by using a ratio table instead (thank you, NCETM). I love using these to organised calculations in proportion problems.
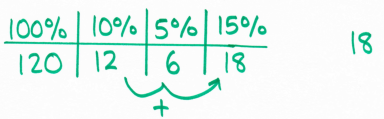
I like that this retains the flexibility of bar modelling in that students do not need to have a strict method in mind, and can begin the question by just finding any percentages (I’m trying to get mine to go for 10% first) and seeing what they can do with it. It’s also significantly less messy.
Question 2a – Simple multiplicative equation (1 mark)
Another fairly simple question – solve 4x = 20. The bar looks like this:
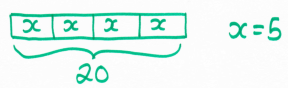
I think this has some potential for students working at (current) grades G/F. For students aiming beyond this, I think the bar model is useful in establishing the ideas, but I’d be pushing towards an algebraic solution. I certainly think any student aiming for grade 4 or 5 (that sounds so weird!) would just see that without needing to draw a diagram at all.
I’m on the fence on using bar modelling to solve equations in general. I can see some applications, but can’t get my head around how on earth you can represent equations with subtractions or negative coefficients in an intuitive manner.
Question 5 – Pictogram, metric units and proportion (3 marks)
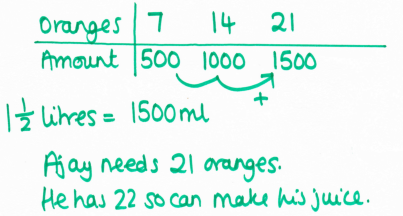
I can see students getting lost in this – there’s a lot going on! First thing they need to work out is that Ajay has 22 oranges from reading the pictogram. Then they need to realise that 1 1/2 litres is the same as 1500ml. The bar looks like this:
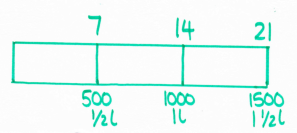
Students would possibly start by drawing a block for 500ml, then double to give 1000ml, then add on another 500ml. I’m still preferring my ratio table solution:
Question 6 – Fractions of amounts, proportion (5 marks)
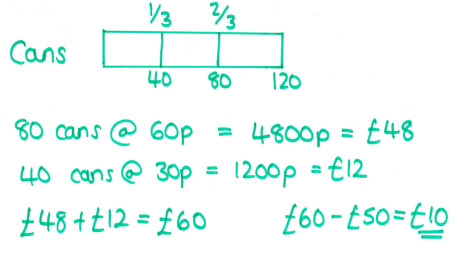
Another multi-step problem; I didn’t even try and use a bar to calculate how many cans Shazia would have – I used another ratio table, but it’s conceivable that students might just realise they have to multiply here.

For the next step, I did actually draw a bar; a lot of my KS3 students are finding bar modelling particularly useful for finding fractions of amounts, but it remains to see how many of them will naturally stop doing that before they get to GCSE.
There’s an awful lot going on in this question!
Question 10a – Simple probability (1 mark)
3 red beads and 1 blue bead in a jar – what’s the probability of picking a blue bead? Quite easy to draw a bar for:

I’m feeling like this might help students aiming at the very lowest grades, but that most would just go straight to 1/4 without the bar.
Question 10b – Ratio (2 marks)
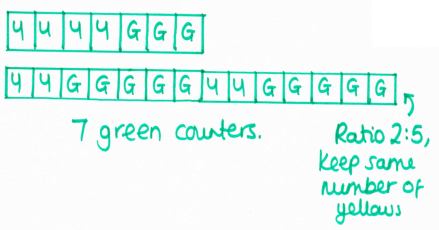
This was the first question I found that I decided that a bar model would be the most sensible way to get a solution. The first bar shows the situation at the start, then the second bar shows what happens after more greens have been added. It’s then just a matter of comparing the two bars to find how many extra greens have been added.
Question 11 – Adding fractions (3 marks)
This question is nasty (yes, I got it wrong the first time – turns out I don’t follow my own advice about reading the question properly). Here’s my diagram:
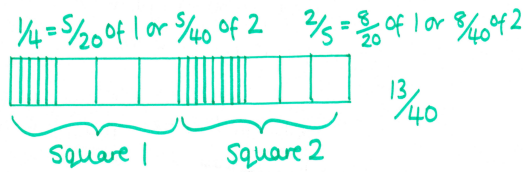
If students are insecure with adding fractions, I’m not sure that a bar really helps here. However, it might be useful in getting them (me?) to realise that there are actually 40 parts in the full two squares. I can see a lot of students writing 13/20 as an answer for this type of question, and I’m not sure yet exactly how I’d teach this so they didn’t.
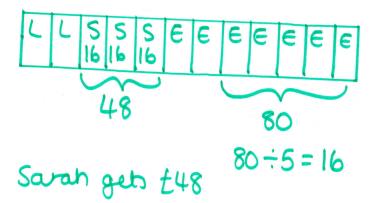
Question 13 – Ratio (3 marks)
This is another tricky ratio problem, and the second example I found where I think a bar is genuinely useful in getting a solution. I tried this with Year 10 this week after some work on solving ratio problems using bars, and they had considerably more success than I expected for quite a complex problem.
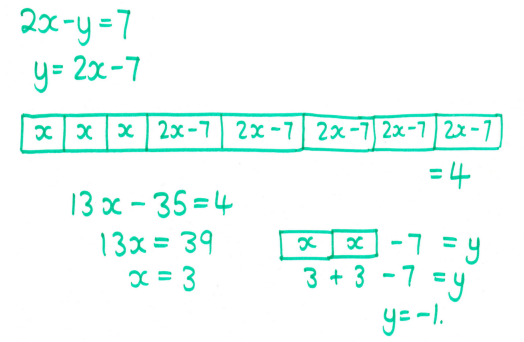
Question 17a – Simultaneous equations (3 marks)
OK, I was reaching a bit by now. This was just an experiment; I’m not sure if students would be more or less successful working this way than the traditional (elimination) method.
Conclusions (for now)
Bar modelling is:
- Brilliant for ratio problems, even in exam situations;
- Great for developing understanding with fractions, but less useful for actually calculating;
- Messy for equations with any negative amounts or coefficients – if anyone can fix this in my head, please let me know!
- Pretty fiddly for calculating percentages and proportion problems – I’m sticking with my ratio tables.
Watch this space to see if tomorrow’s session changes my mind!