linear graphs

LOTW – Making graphical and algebraic links with simultaneous equations

I’ve been super-lucky this year to get a top-set Year 10 group on my timetable – I’m feeling dead happy about this because:

  • I taught them in Year 7, and they’re a great group – very enthusiastic about maths, a bright bunch and some fantastic personalities;
  • I haven’t ever taught a top set at GCSE (because I teach A Level) and new experiences are always reinvigorating;
  • I get to teach all of the new GCSE Higher content and explore all that;
  • I’ll get to do the FSMQ with them in Year 11 (yet another new experience).

However, I had a mild panic when it came to planning their first lesson this week; having chatted to their Year 9 teacher, I discovered that they know quite a lot of typical (old) Higher content already, particularly the algebra stuff. However, I wanted to make sure that they’d really got it (linking in with our Mastery curriculum) and also begin to work on their problem-solving and reasoning skills a bit more.

The mild panic was induced by the fact that I hadย no ideaย where to pitch the lesson – I’m so used to working with C/D pupils at GCSE that I had no concept of what these pupils could do and how quickly. However, the first three lessons seemed to work really well; I’ve really enjoyed them (and I hope the pupils have too!), so thought they should be my lesson(s) of the week.

Starting with graphs

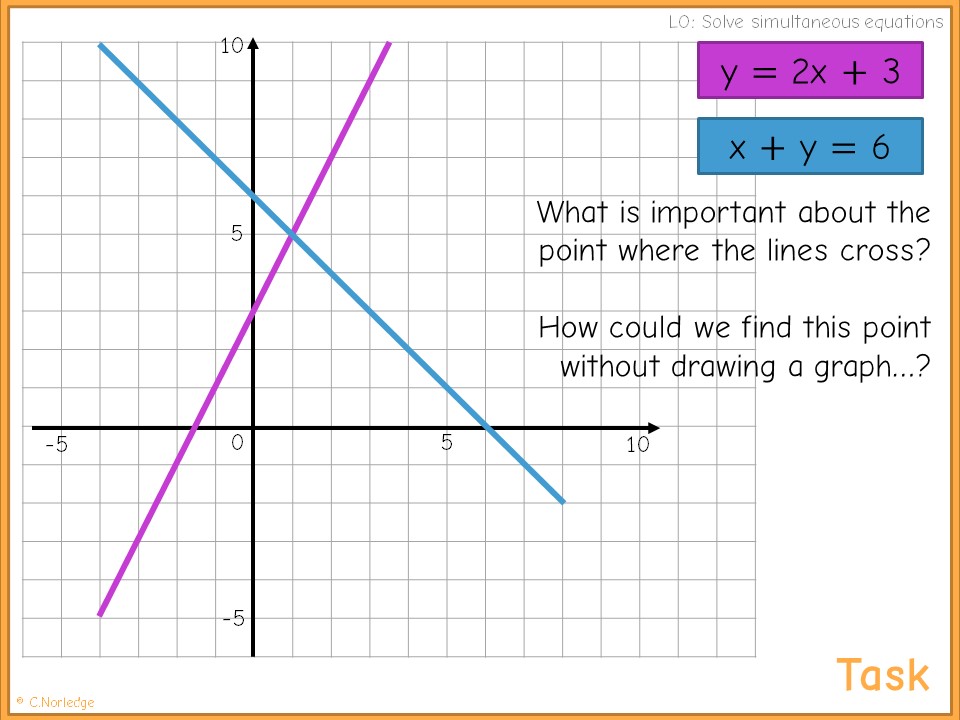
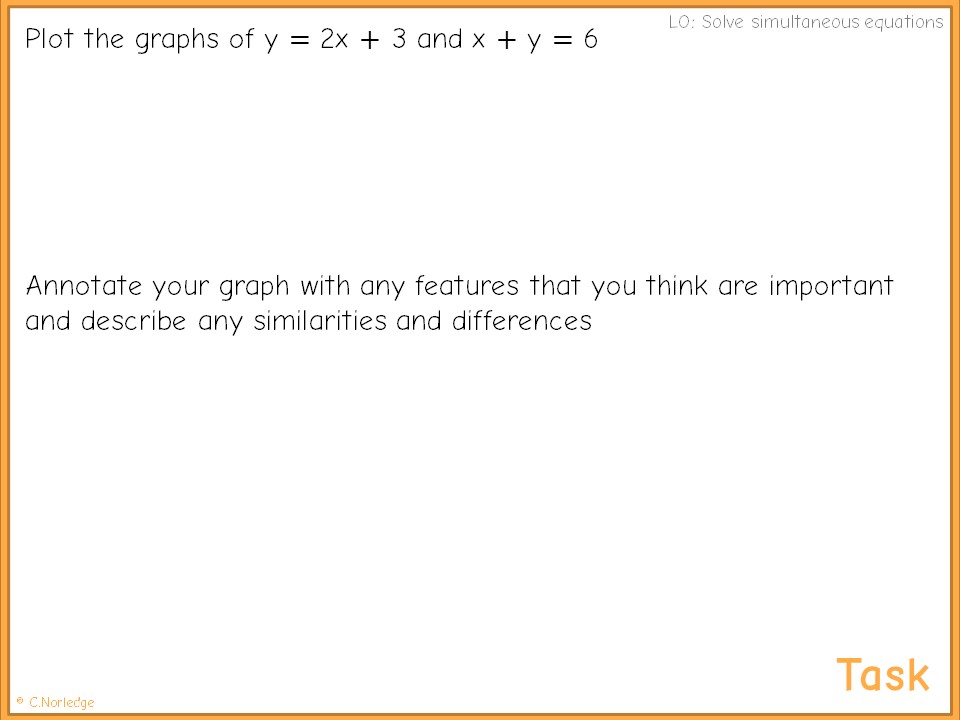
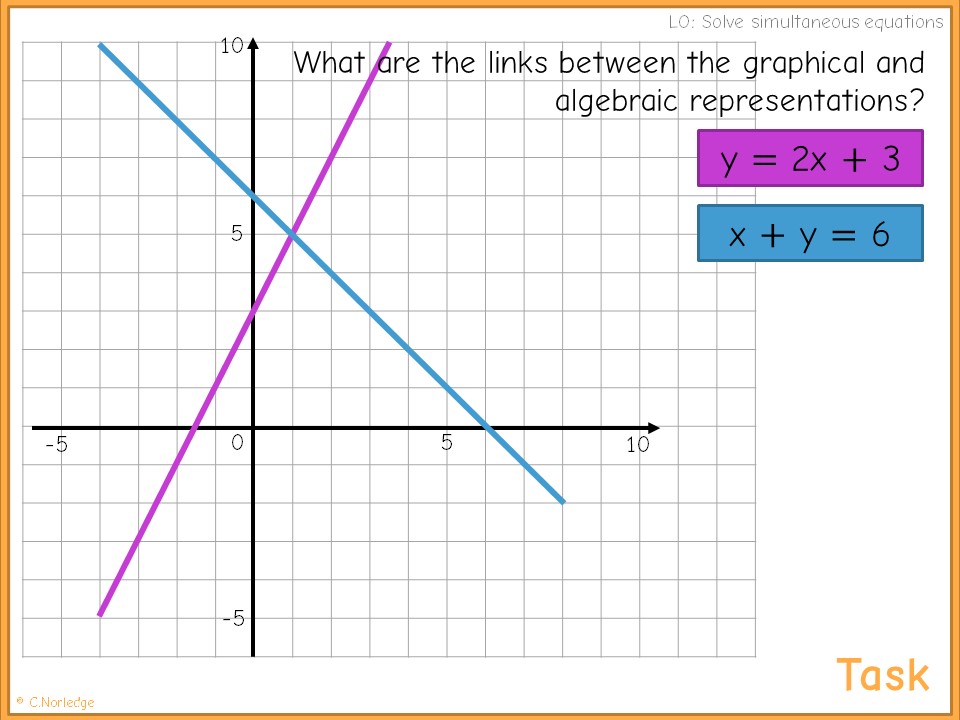
After going briefly through expectations (nice not to have to do a huge spiel on this as I already know them!) and GCSE changes, we spent about thirty minutes working on a graph of two intersecting lines.

I got them to draw the graphs (thereby checking that they could actually do this quickly and accurately – a couple did need reminders!), then annotate any features they could spot. We had a class discussion about what they could see, and talked about gradients and intercepts, intersection point, why this was important, the different forms (y = mx + c and ax + by = c), constants and coefficients – I was looking to make as many links as possible and probe for prior knowledge at the same time.
Moving to algebraic methods

At the end of that lesson, I asked them to show if they could find the intersection point algebraically – when I checked the books, about half of them had made a decent attempt at this using substitution. We started the next lesson with a chat about advantages and disadvantages of graphical solutions, then talked about the other two “methods” they remembered.
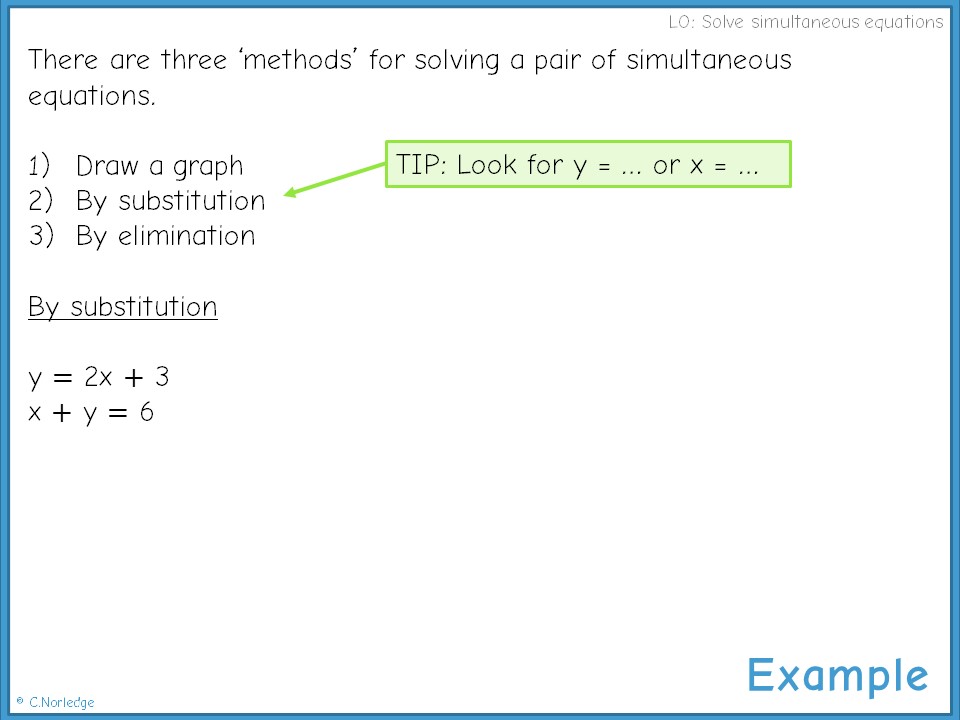
I wanted to get away from the idea that they’d do this type by method x and this type by method y, so we talked about how they’d see these “methods” in revision guides, but really it’s just sensible use of the algebraic rules they already know.

The pupils then did some practice problems – I’d picked questions that ramped up gradually and threw some fractions and negatives in. They got on with it with limited assistance, whichย gave me timeย to circulate and check they were doing things like showing their working correctly.ย 

The unsolvable question

The final question in the set of problems was this one – the pair represent the same straight line, so this was an ideal final question for getting any early finishers to really think about what was going on. Some of the very fast workers are great at applying methods quickly and accurately, but need to work on thinking carefully and analysing what’s going on mathematically, and it was quite funny to watch the frustration that occured when the problem kept reducing to 16 = 16.
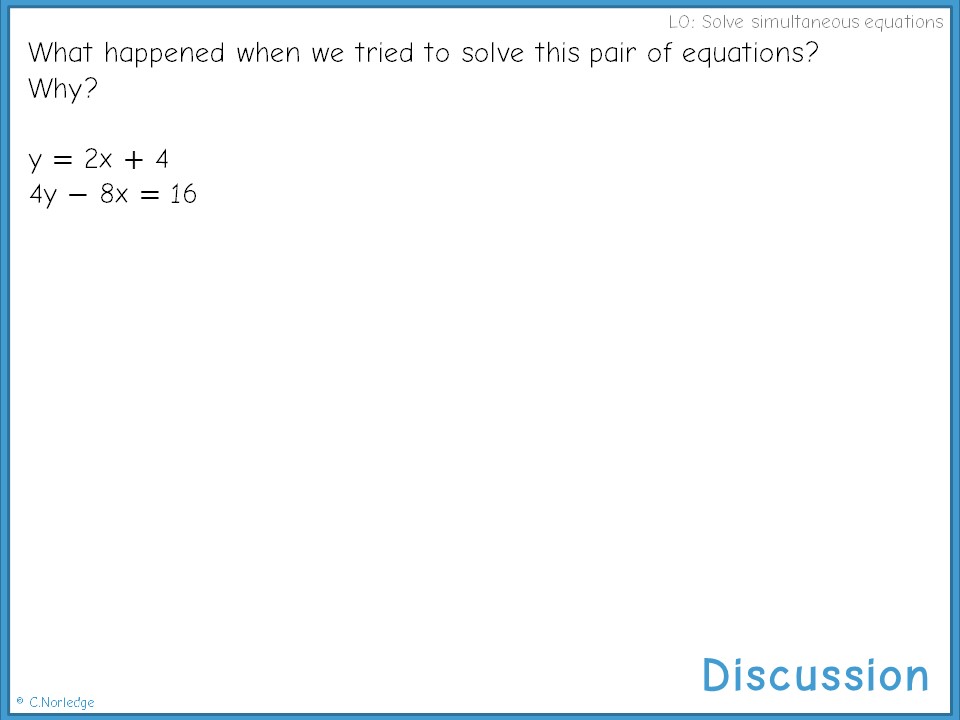
This led into an in-depth discussion in our third lesson about exactly what was going on in this situation; we had suggestions that the lines were parallel (as we’d discussed previously that parallel lines won’t have an intersection point), then someone realised that the second rearranged to give the first.

I used the Desmos Graph tool to demonstrate putting both on the graph, then we considered what would have happened with a pair of parallel lines – getting a contradiction rather than a trivial fact like 16 = 16.

My lessons with this group so far have run rather like A Level lessons (aimed at a slightly lower level) – lots of discussion, taking important notes, practise and modelling my thought processes and reasoning. Whether this works well as a model for getting this group to improve their problem-solving and reasoning skills, we’ll see as the weeks go on! I’m planning to start the next lesson with Matchless from Nrich to see how they tackle that.

We’re going to do some more work next week on modelling and using simultaneous equations (I’d normally start with this if pupils have no prior knowledge), then probably onto a similar treatment of one linear, one quadratic with links to graphs.

LOTW – Making graphical and algebraic links with simultaneous equations Read More ยป

Proportional reasoning on Edexcel June 2015 P1

I’ve written quite a few posts recently aboutย using ratio tables extensivelyย in my teaching for proportional reasoning. Following the explosion on Twitter about Edexcel’s non-calculator paper last Thursday, I thought it might be time for a critical evaluation on my part of just how useful (or not!) they are in tackling any or all of the proportional reasoning problems on the most recent paper, particularly if we should see this as an indicator of things to come, as @El_Timbre suggested in thisย brilliant blog postย on Sunday.ย 

I’m approaching this from the point of view of pupils aiming for a grade C, as I’ve had borderline groups for the last two years, and no top GCSE sets for about four, due to having plenty of A Level Maths on my timetable already, so I’ll admit that my pedagogy and knowledge of grade A/A* topics at GCSE is fairly limited.

Q1b Percentages from a stem and leaf diagram

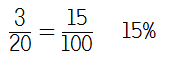
I posted about how useful Year 11 found ratio tables for converting fractions to percentagesย back in May, and I was happy that at least three pupils mentioned to me after their exam that they’d used this strategy on this question to get the correct answer.

I’m still pretty convinced on dealing with fraction to percentage conversions with ratio tables, but I can see that it might be a little unnecessary here. I’d like to think that once pupils had got the fraction 3/20, they would spot that 20 goes into 100 five times and multiply the numerator accordingly.

Q4 Plant comparisons

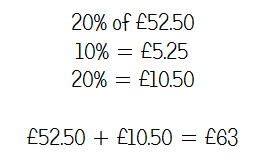
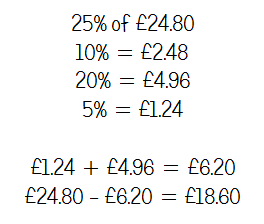
Overall, I thought this was a nice little problem-solving question. It involves pupils working out a percentage, then deducting this from the total cost. Again, I know that most of my groups have found ratio tables useful for structuring their working out, but 20% is a fairly simple percentage, so I can see some pupils not bothering.

Q9 John’s conference

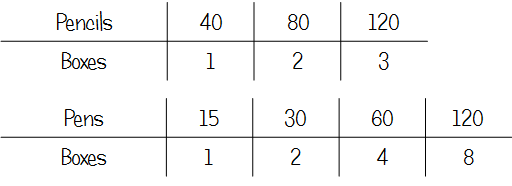
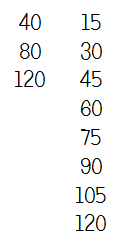
As the Twitterverse astutely observed, why not get people to bring their own pencils? However, assuming John doesn’t want to put people out, this was a fairly straightforward LCM problem. I quite like the ratio table approach here as it tidies up listing the numbers somewhat, and might avoid any silly errors with miscounting the number of boxes at the end. It also allows pupils to double up to 8 boxes of pens without having to write down each number up to 8 x 15, again eliminating potential for slips in calculations.

Q10 Mary’s conservatory

I’ve been trying to encourage my Year 11s to scrape every single mark on the Higher paper, and split problem-solving questions where possible. Many of these area/problem solving questions include a percentage calculation that can be done without needing to find the area first. 

In a similar vein to the plant comparison question, the only benefit of a ratio table here is structuring working out – I don’t think it adds anything in terms of making the calculation more straightforward.

Q11 Karl’s game

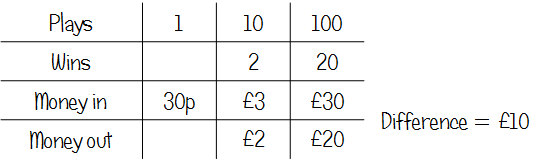
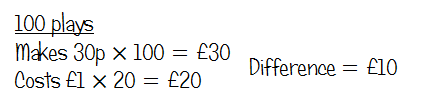
Again, a table offers a bit of help in terms of structuring working out here. If pupils get used to constructing these for themselves, it’s conceivable that they’d find this useful to put in what they know, then work out anything else that they can. It might help them to make the link between 10 plays in part (a) and 100 plays in part (b).

Q14 Raksha’s journey

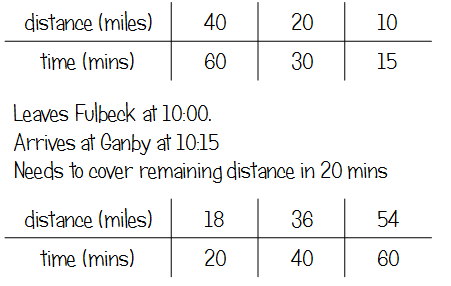
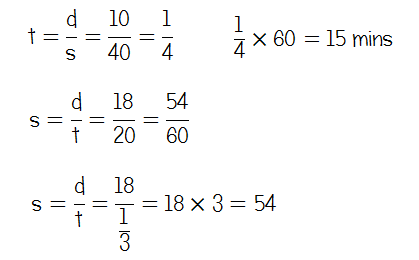
This is the first question I met that really convinced me that a ratio table was the superior method or way to structure working. From conversations with pupils (and reading on Twitter), I know that those who applied the sdt formula got really confused with units – there needs to be an appreciation that the time is given in minutes but speed given in miles per hour. Structuring using a table kind of avoids these errors in the first part of the calculation, and makes it clearer to see what you need to do in the second part to get an answer in miles per hour.ย 

Q15b Does the point lie on the line?

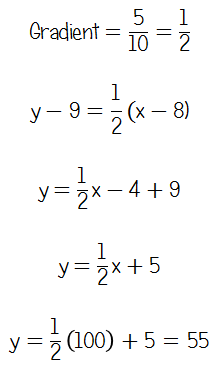
This question pulled me up short a bit – I’ve avoided this with my Year 11s this year in favour of cherry-picking easier marks – but when I was doing the paper, I immediately used the “A Level” formula y – y1 = m(x – x1). I went back and checked over the current and new GCSE syllabi, and finding the equation of a line given two points seems to be listed as new spec only, but, as I said at the top, I have limited experience with teaching A/A* topics and related pedagogy.

According to this site, it’s a new topic coming to Foundation and Higher, so there are obvious implications for teaching next year.

Chatting to a few pupils in top sets, many of them either found the gradient, then substituted in one point to find the y-intercept, or, overwhelmingly, used a sketch.

A colleague suggested that the approach she had used was getting them to work out the gradient from the two points, then work out if the third point gave the same gradient.

However, I started to think about making this question accessible for borderline pupils who (let’s face it) won’t have as developed algebra skills as those aiming for As or A*s.

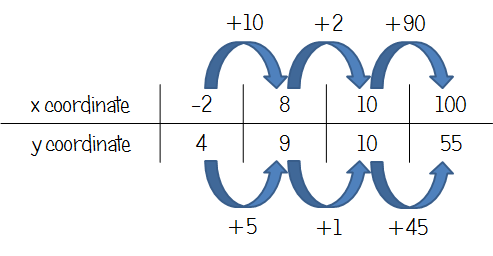
Now, obviously this isn’t really a “ratio” table, as we’ve got a linear relationship, not direct proportion. However, if we look at the change in x and change in y for the two points we’ve been given, it’s clear that the increase in x is double the increase in y. 

From here, it’s not too difficult to get from 8 to 10 and then 10 to 100 with the x coordinates, resulting in a y coordinate of 55, proving that the point (100, 56) is not on the line.

Whether or not this is an acceptable way to “show how you work out your answer” remains to be seen!

I’m not meaning this to be a passionate argument for the use of ratio tables – they work really well with some pupils for basic percentage calculations, and (I think) have stopped some of mine from just panicking in an exam and working out “something”, then going from there. I think use for SDT and DMV may prove really useful, particularly for those that struggle to rearrange formulae.

What do you think? Drop me a comment below!

Proportional reasoning on Edexcel June 2015 P1 Read More ยป